
Friday, 28 February 2014
EURUSD: looks like a fractal
It is a fractal of the ride up into the xmas high. Looking for retest of annual pivot or interim support line, most likely 1.3560. Reversal pattern required but longs not an option for me unless 1.3745 holds after solid retracement.
EURUSD
So much for my day of rest! I am going to be nibbling in shorts every 25 pips or so: the FLD chart has a very clear 40 day trough below, and although we have just had a combined 20/40day FLD bounce that went according to plan like a dream, I am now looking for the next move. See how price is moving into the daily bollys again at the 1.3818 square root progression calc - these bollys have been tweaked a bit to make them harder to reach (not SD of close!) - so I reckon the 40day trough is going to either cause a diagonal to build above or a drop. Either way, I am selling relative highs from here.

EURUSD
Just banked all of that and thank you very much indeed. Will let this settle and reassess later.

EURUSD
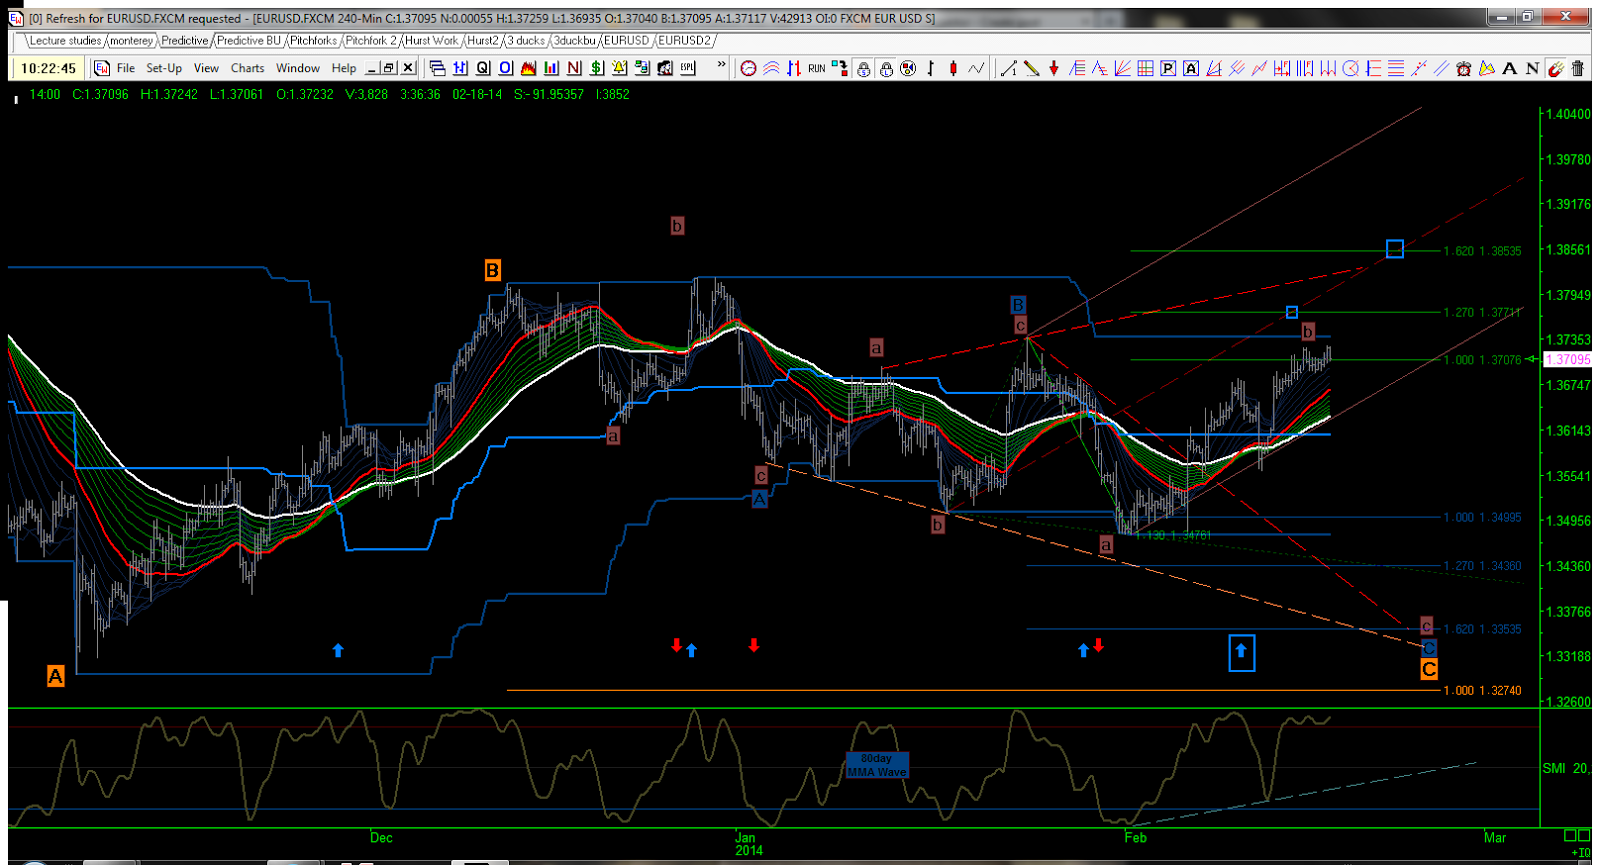
I have re-jigged the count a little to take out the expanding diagonal and add in an expanding flat. I think the 162% extension makes a lot of sense in testing the 1.3892 high from Christmas and keeps the red dashed trend line in play too. Not much different, but helping me focus on that target if we can see a push past 1.3745.
 Now, I might be ill, but them dogs still need walking and it is absolutely chucking it down outside with rain - great!
EURUSD

Thursday, 27 February 2014
EURUSD
Taken the opportunity to bank a few more shorts with the 4hr momentum cluster making positive divergence suggestions. The 5day, 10day & 80 day FLDs are all sat together at 1.3745 (a square root progression number off 1.3892 and 1.2041), and a successful break of the golden 160d.fld, should see an attempt at this zone at least. Looking for this 20day/40day zone to hold here, as recall it also holds the 20,50 & 100 day SMAs - see yesterday's posts.

EURUSD
I have my longs covered directly under yesterday's low, but looking for the 160d.FLD to break to the upside, based on the placement of the momentum study. Whether or not, the 20d & 40d.flds have had enough of look in thus far, is the question, but a break above the gold FLD is likely to see price push back on the 80d.FLD above with renewed passion. The MMA wave has the 80day (green line) still above the thin gold 160day
trend, so if the above comes to pass, we will have confirmation for
now that the 80day trend is still in command, which is why a break of
the blue 80d.fld would be interesting at this stage of the momentum
study.

Wednesday, 26 February 2014
EURUSD
With the 20 & 40 day FLDs pretty well backtested, any trip back north through the 160day FLD, will leave the 80day FLD with all the permissions it needs to progress uphill - see last post. This is the count I am running with for a longer 'e' leg in my 'B' diagonal and likely to follow a contracting diagonal into the close. May as work it right up to the 1.3892 high, but will be flat well before that!!

EURUSD
This is getting very close to my target zone from earlier today (and all week!), so I am edging net long here and will look to build a greater position if the drop moves my remaining shorts into profit.

EURUSD

EURUSD
Yesterday's chart was a stripped down version of today's. Just wanted to keep the SMA cluster in mind - we have the 20,50 & 100 day SMAs, all in the 1.3620-1.3650 zone, along with the 20 & 40day FLDs - see red sidewards arrow in main chart. I'll not be betting on a 'cut' here and will bank all shorts or cover as price approaches (if it does!). The market sees the triangle that has been building of late, but unless last week's high is taken out, I am short and hopeful, whilst my trend indicators show the 5x10 & 10x20day trends are bearish (sub chart)..

Tuesday, 25 February 2014
EURUSD: zooming out


EURUSD
The break through the blue daily & purple 5day FLD this morning followed the backtest of the red 10day FLD yesterday, which was also yesterday's low. I have banked my longs from last night on the approach to yesterday's high and will re-engage if the high gets taken out from last week's high (1.3772).

With the 20day trend (see sub chart) still negative, and with the 80day low (see weekend report) due at the end of the month, I am keeping to the short program until that 20 day FLD (orange ) is hit.

The manner in which that eventual move pans out, will help to decypher this mess, which for now looks like a diagonal - see the range bar study below.

With the 20day trend (see sub chart) still negative, and with the 80day low (see weekend report) due at the end of the month, I am keeping to the short program until that 20 day FLD (orange ) is hit.
The manner in which that eventual move pans out, will help to decypher this mess, which for now looks like a diagonal - see the range bar study below.
Monday, 24 February 2014
eurusd

Sunday, 23 February 2014
EURUSD - weekend review
I'll be in lectures until tomorrow evening, so a summary now and I'll probably be off air until Tuesday.
 Cyclic Phasing: always assuming that my interpretation is correct of course, I have the 80 trading day low coming for the end of the month. The only 10day cycle within that, that did not come in almost to the day, was the 7th, which was early. So, I am looking for an 8th 10day low to conclude this 80day cycle which has spent half going up and the 2nd half going sidewards. The Raff Regression channel from the last 80 day low has its LTL at just below the annual pivot (1.3476) and a touch there would be a neat to say the least. This would mean price 'cutting' the 20 day FLD (orange) to reach down to the VTL (pink dashed) also sat at the annual pivot (white dashed) or the Harmonic line at 1.34375. I don't really mind how far price pushes downhill, as I am net short, but catching the lift up the other side might be very rewarding indeed.
 The 5x10 & 10x20 day trends were negative on Friday, notwithstanding the recovery late on, (see 1st sub-chart) with price hovering above the 80day FLD and the 160day sat right underneath. The placement of the 80day FLD is the key anchor point for me, once I am confident the 80day cyclic low is in place. The further away price can be from the FLD, at its cyclic low, the more punch I'll get for my risk long later. A move down through the 80day & 160day FLD this week, should zip through to the 20day & 40 day FLDs with no issues whatsoever (being half way points of smaller cycles) and I think that daily bolly band and 200dsma look just peachy for a realistic eventual target. The question I ask, is where the market would want to be before committing long and that seems to be a great supply zone to me. Will it get there is not up to me!!
 Moving into the 30min chart and we can see that price action created an inside day, Friday. The 1-5day trends were all positive at the close, but price was being capped by the weekly FLD, with the daily and 2 weekly FLDs below the daily pivot. There was enough potential in the 4hr momentum studies for me to cover half my shorts at the close, although I hope to lose them for a small gain or BE before any move downhill gets going. Generally, I am looking for a move down to the 20day FLD at the bottom of the chart and that then to get 'cut' to the downside, to mark the half way point in a move down to the 1.3476 area (hope!!).
 As matters stood Friday, the Range Bar Studies all remained bullish, albeit they are derivatives of each other of course. What I am looking for is a push down in the 48pip RBS with a nested low in the momentum study by the end of this 80day cycle and then a turn up in the 12RBS and backtest to enter long, coming out of that low. Will it all go according to plan? We shall see!
12pipRBS

24pipRBS

48pipRBS
12pipRBS
24pipRBS
48pipRBS
Friday, 21 February 2014
EURUSD
Price just could not hold the underside of the 80day FLD or the LTL of the regression channel up from 1.3476 today, although is sat inside the 5day FLD at the close. With the daily bollys and 80day price envelope in the 1.3818 area and the 4hr momentum cluster looking poised, I have banked all shorts in profit from the bouncing price action today and covered half of the rest. This feels like perfect 'peek, poke & drop' territory with that roof space above and the need to get down to the 20day FLD below as well, and it could be a 5th up to complete the assumed 'e' leg. It has been very profitable playing the range to the downside this week and there is still all of next week to fit in my 80day cyclic low, so plenty of time for a drive down, even if there is a new high, first. I did not want to go into the weekend with naked shorts alone, but I am 50% net short and comfortable with that. Have a great weekend everyone.

EURUSD
Well, a 'b' wave triangle, but in the other direction! If the high can hold out, then perhaps a more aggressive, 1-2, but if not, I am still looking for a move down into the month end. I'll mark it up as a 1-2 for now.

Currency Trading has been difficult......apparantly
This article in Bloomberg caught my eye. I have had my best ever start to the year, as the work over the past 6 years has bedded in. It has been tough with the tight ranges, but my 'Lines in the Sky' methodology continues to provide measurable storyboards and directional cues. May it long continue, although I accept everything has its day in the sun.
EURUSD
I suggested yesterday that consolidation under the 80day FLD might occur, and it seems that we have a triangle ready to feed the next drop down. If this is a 'b' wave then a measured 162% extension from the top, takes price to the Monthly Pivot at 1.3580. Not a bad place to bank the shorts and sit out the weekend and my lecture day on Monday. Catch up later.

EURUSD
Not a lot of upside created in price overnight, although momentum has reset enough for me to be interested again in being short. Price has held under the 80day & 5day FLDs, which brings the 10day, 40day & 160day FLDs into the 'ladder', sequentially. I am looking for the 20day to be hit somewhere on its route and to do that, price will have to get through the rest first, along with the 20/50 & 100day SMAs. A tall order if that lot wants to be support, but a lot of stops in a tight space if that is what the market wants as fuel. For now, the 5/10 & 10/20 day trends are downhill, so I'll keep following them down until they turn up - the momentum study on the 12hr chart (last) suggests there is some room to go, albeit price is fighting that new 80/160day bullish trend, quite fitting given I am looking for an end of month low in the cyclic phasing work.


Thursday, 20 February 2014
EURUSD

EURUSD
Have banked the longs and re-building short positions again. Price sat below yesterday's low and may consolidate here to burn up oversold momentum. I have the 10/20day trend now turning negative and any thrust down, could catch lower, so I am short only and will cover on a new high.

EURUSD
Price has stalled at the 160day FLD (gold line), which is also the regression channel perimeter of the move up from 1.3476 and above the 20,50 & 100day SMAs. Although the longer term momentum studies have only just got going to the downside, I have both the 1hr & 2hr studies oversold with price action stalled at this bus stop. I have taken the opportunity to bank all the shorts taken out above this point and covered the rest, whilst I wait for these two shorter term studies to reset themselves in a retracement or otherwise. Whether I have been too cautious or not is not an issue with Claims out this afternoon. Flat and content for now and hoping for another stab downhill from a higher vantage point or similar, but with any uphill momentum worked through by the market. With price under the daily pivot and the 1/5/10day trend bands all facing downhill, and with longer term momentum studies up to the daily, all teetering in overbought, there is no option for me to buy this. Catch up later.


Wednesday, 19 February 2014
EURUSD
With the ongoing saga developing in Ukraine, it is interesting to watch this EURUSD price action coming into a cyclic high, before my 80day Cycle low is due at month end (see yesterday's phasing report). The momentum study here obviously needs to rest at some point, and it is this downward storyboard that I have been interested in since Friday. I have overlaid the 20,50,100 & 200day SMAs, for a sense of purpose, and if price is to reach the FLD trough in the 1.3500 zone, it would need to clear all of these SMAs and the 160day FLD too. The point being, there is stiff support in that 1.3600-1.3650 zone, but clear that and the 200day SMA at 1.3400 must be the initial target. Given that this is below the annual pivot at 1.3471, I'd expect any impulsive move to be a little more dynamic than of late. We shall see, but no room up here for me to think long but that 1.3600-1.3650 area will be key in assessing any progress in either direction.

Tuesday, 18 February 2014
EURUSD


I am running two EW counts, both looking for a move down to fit the Cyclic Phasing. The first calls for this to be the 5th leg of a 'b' wave expanding diagonal, and the second as a 'b' wave in a zig zag. I think the second count fits better with the phasing but that assumes to the 20day FLD holds in the second chart. So, I remain bullish longer term, but bearish until my shorts are banked - now is that biased??

Friday, 14 February 2014
EURUSD

EURUSD


EURUSD
If my Hurst Cyclic Phasing continues to hold this 80day cycle together, the 80 day low is due at the end of February. That low Wednesday, could have been the 7th 10day low, but it would be very early and I'll work on the basis, it is not. As such, I am looking for that low to come in next week, but the rise out of that, then likely to be a 'b' wave, providing room for the final drop into the 80day low to unfold. These ends of cycles are a little fraught with emotion, not least of all, mine, with the possibility that the cycle is already over and it is my bones being picked clean. I do not think it is over and the next drop should be part of a final move down, and as such, there should be a persistent impulsive move to prove it. For sure, if all goes well, catching the thrust out of that low in early March should be very rewarding indeed.

EURUSD
Little expanding diagonal there on the 3min chart, having broken out of yesterdays consolidation. A break below yesterday's high, would move price in the bearish direction.


EURUSD
Well, the direct route down to the 10day FLD has not been taken, but the drawn out price action yesterday suggests a different larger prize. A decline now to retest the Annual Pivot would push through the 10day, on the way to reach the 20day FLD, now in trough territory below - see orange line and green arrows. Looking for a move down towards the pink trend line that joins the last two 20day FLD troughs near 1.3500. I'll bank there and reassess the momentum study (hope!!) as again, the next 10day low is due 17th/18th next week.

Thursday, 13 February 2014

EURUSD
EW Count updated - have tidied up the 'Blue' waves to make the overall pattern more symmetrical. The count still looks for a commitment southbound to get the 'C' wave on the map.

EURUSD - just a little room to breathe
Here is what I am looking at on a 48pip range bar chart. May or may not hold, but giving just enough room to breathe.

EURUSD

EURUSD

Subscribe to:
Posts (Atom)