
Thursday, 29 August 2013
EURJPY
It is a busy chart and needs explanation but I got packing to do, so there isn't going to be any. Probably more than likely, this is part of 'b' of 'e' and I reckon resistance at 131.30 or if that not hold, 132.00. Catch up later when I get back from holiday.
Wednesday, 28 August 2013
EURJPY
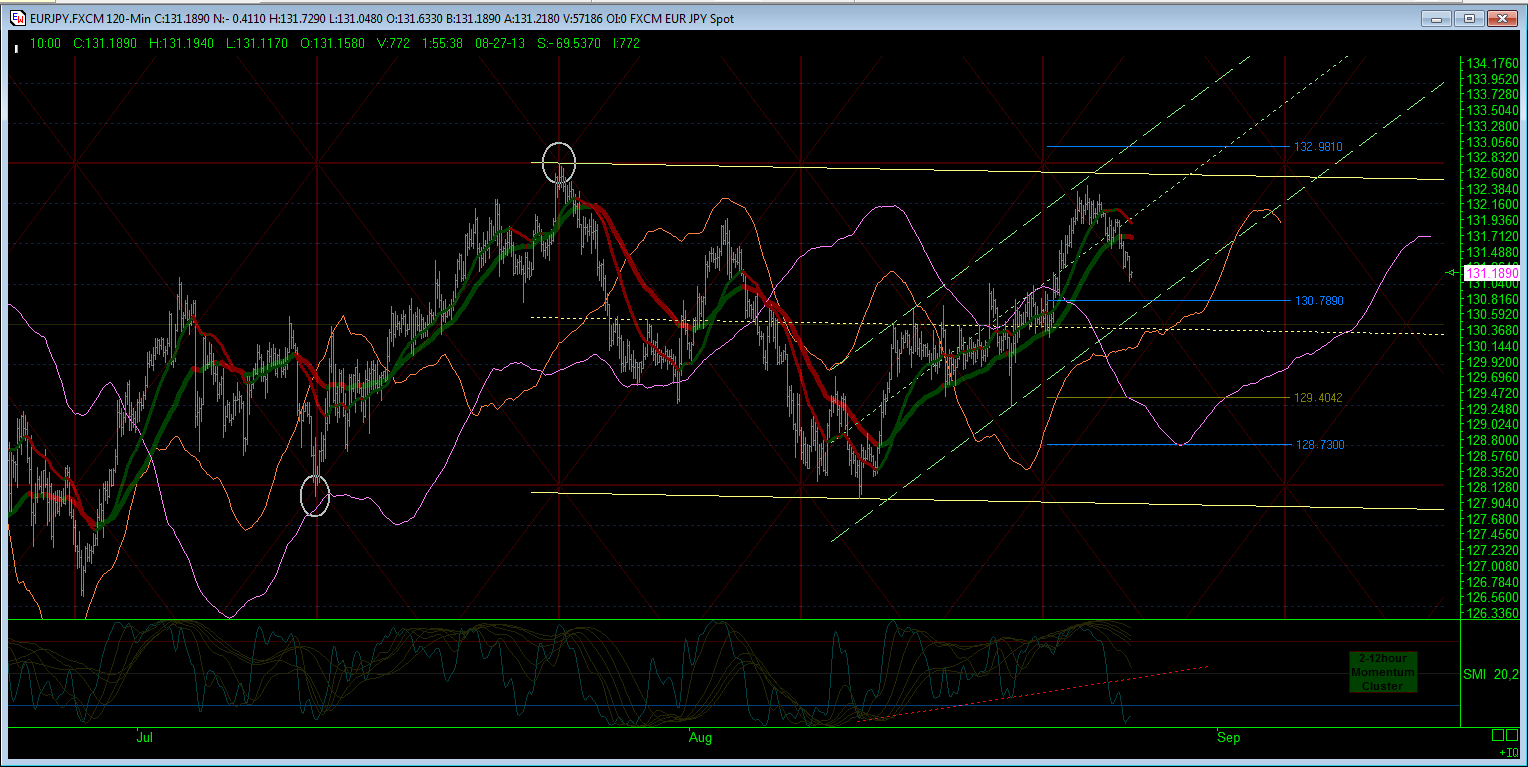
1-3day Hulls have all moved to positive and stacked correctly too. 25day regression channel now started tilting uphill as I pointed out would happen if we got a bottoming PA sequence. Momentum clusters starting to look like the downhill moves may be waning if not over for now. Fingers crossed for triangle pop although a deep 'b' will be just fine.


EURJPY
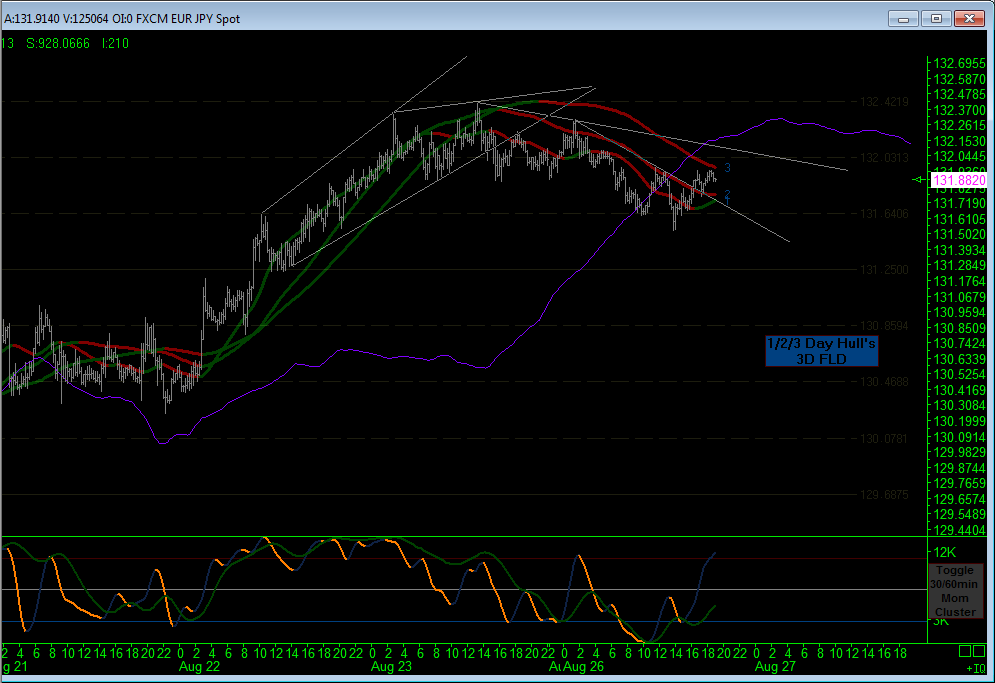
Looks like my regression channels are holding. Is this 'b' in 'e' in the triangle or is 'e' all done and off to the moon we go? Looks like the former, but I am not putting my hat on that and will follow this up and see where it goes. 'd' high was 132.416, so a breach there and don't be caught short is my opinion. I have seen some EW counts suggesting this triangle is a 'B' wave overall and not the 4th that I am running with - interesting!!


Tuesday, 27 August 2013


EURJPY
If I had a script at the weekend, it has now been fulfilled. All shorts closed and now naked long. Looking for a bite somewhere around here. Off out for the day now.

EURJPY
Have been closing out shorts in profit, taken out on the way up and now moved to net long by 40%. In the weekend summary, I suggested the 45degree angle would be a supportive runway for price action and so it has. Over the next day, the monthly price high to the left of the big channel (25 days) is going to drop out of the regression calcs and the channel will snap uphill. So, either we have a new trend downhill as per the trend lines which are now both red, or this PA is corrective as per the 'triangle' thesis. I am hoping for a 'b' wave up before a 'c' wave down to finish the 'e' leg of the triangle, but do not want to be caught out by anything else north bound. But I do not want to over commit up hill yet either, in case the 'c' wave of 'e' takes up all the the triangle. So, nudging long and hope to bank that later as a 'b' and then top up shorts again for 'c' down. We'll see.

Monday, 26 August 2013
EURJPY
It does seem that the triangle on the daily chart is holding and as such price would be now descending into the 'e' wave, before thrusting higher. Referring back to the weekend summary, this would put the 'c' wave of the triangle as the 100 day low, although it maybe simpler to describe the whole triangle as the low formation. I have this as a wave 4 consolidation on the weekly chart, so wave 5 to follow. We shall see. For now, the daily momentum study is looking leggy and I'll look to add in more shorts where I can.

EURJPY
Not a lot going on today - have closed longs for reasonable profit and now just short again - not topping up here though with inconclusive PA - again! However price is under the 3 day FLD and for the moment the Hulls are still staggered downhill.
EURJPY


Sunday, 25 August 2013
Saturday, 24 August 2013
EURJPY Weekend Summary

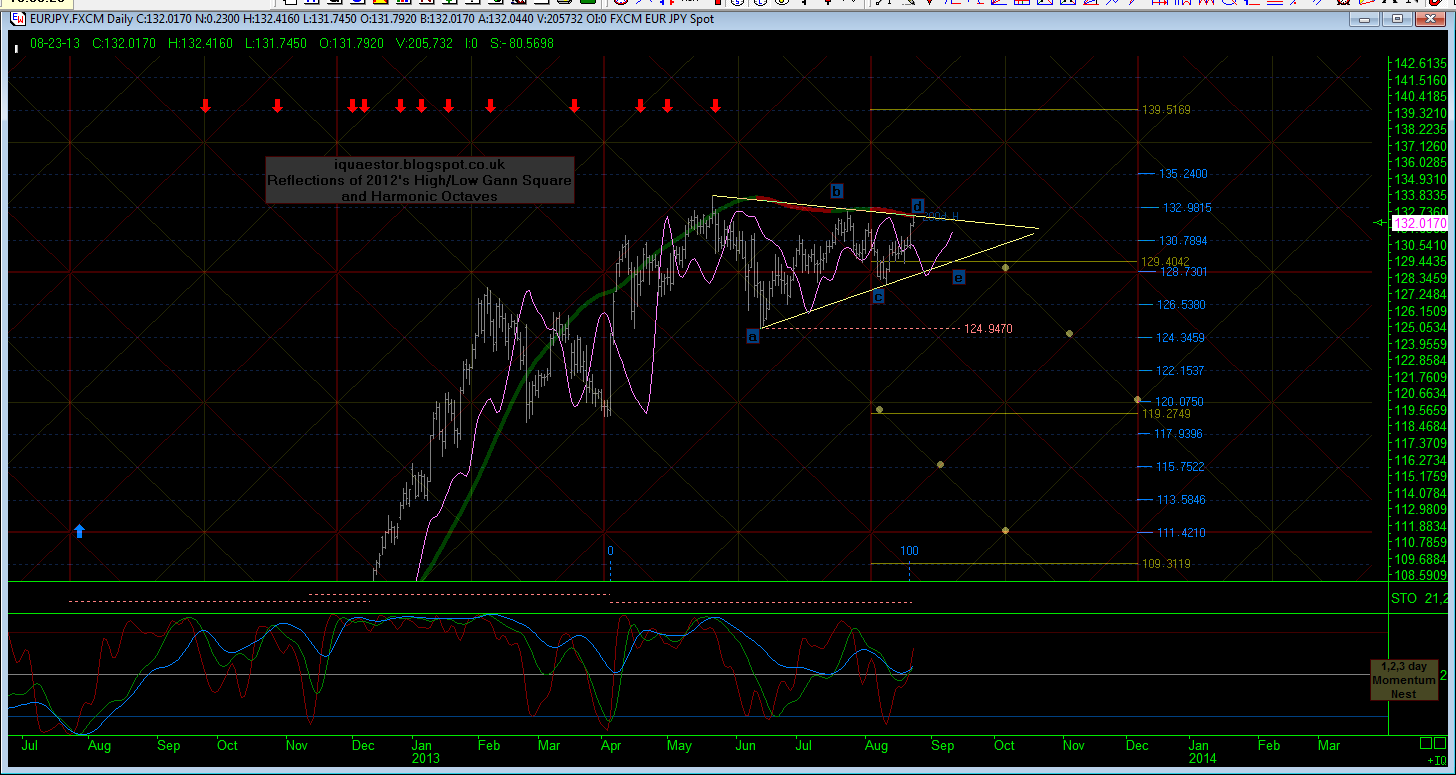
Price is still rolling around the 50% Harmonic Octave & Retracement line for the 'all time' high/low wave. I have drawn in the red triangle as a guide but we will need more PA to confirm that is what is going on. However, if this is 'b' of 'c' down being formed right now, then the correction could be a flat and only an overall 'a' leg at that. Punching string at the moment. We do have negative divergence on the momentum cluster on the weekly study and overall overbought on the monthly. My gold arrows highlight the proposed path to test the 10 year Hull MA riding up the 45 degree angles, but that is long term and not for intra-day trading 
On the daily chart, a smaller proposed triangle to the one in the weekly chart is shown. It is too neat to ignore but of course could be the 'ab-ab' mentioned above, instead. I mentioned last week that I did not like the daily momentum study for the bearish case and that has been proven correct. It now looks like it could drop, but it is not overbought at all. There is possible divergence there over the extent of the rise in price vs momentum, but it is marginal. Price has reached the underside of the 200day Hull which remains red for sell and price has meandered around the 45 degree line without a crisp clip on either side which keeps me bearish overall for now. We are due a 100 day low and I continue to dismiss the 'c' low in the triangle as that low already in - I might be wrong, but for now I am looking for something more punchy. A retest of the triangle lower perimeter would coincide with the all time high/low harmonic octave at 129.4042, the annual HO at 128.73 and the reflected Gann Square floor.


Friday, 23 August 2013
EURJPY
Reckon that was an extended 5th in an expanding diagonal to finish off 'c' up. Back testing at moment. We shall see if the drop is on.

eurjpy


Thursday, 22 August 2013
EURJPY
Just could be a smaller triangle in the 4th; smaller than I was expecting anyhow. Will see how this tops out. Carrying shorts into any turn, so hoping for one, regardless of depth.

EURJPY
If the expanded flat (red legends) is correct in this 'c' leg of 'B', then we are at 127-162% extension of red 'A-B'. Increasing shorts and looking for move down.

EURJPY
Back at it. Count looks better as an expanding flat in the 'c' wave to finish 'B'. We may be or maybe not there, but I am building/rolling short positions, especially given divergence from Dow Jones price action.

Tuesday, 20 August 2013
EURJPY
Perhaps something like this? Maybe we are going into 'c' of 'a' which is the first leg down in bigger 'abc' which in the bigger picture could be turning into a triangle - oh what fun!


EURJPY
Taking a break from other work and glad I banked my longs earlier before the 'b' wave down. I think we have turned downhill and am shorting this possible 'c' wave here on the 3min chart. The purple 'wave' is a daily trend and looks choppy at the moment. Could be a waterfall.......

EURJPY
Maybe an expanding flat or maybe it has already turned down into that 100 day low I have been chasing; volatile regardless. Have banked my longs here and now completely out. Got to focus on other work for rest of the day and then out of office all day tomorrow. Catch up Thursday, although gotta feeling there will be lots of pips left on the table! Hey ho.


Monday, 19 August 2013
Warning
I will be attending to other business matters on Wednesday and will not be be trading or commenting during Europe/London in any way. May be back for Sydney open but might just give it a rest for the day altogether. Just so you all know but thanks for reading.
EURJPY
Shorts looked good but lack of impulse suggests this could be a 'b' wave or part of diagonal structure. Trying long again here.

EURJPY
I have been shorting this possible top since 131.00 and have banked 3 trades thus far. But, as per my weekend report, at some point that 100 day low is going to need satisfaction and I am chancing a longer term short hold from here-on-in. I'll take on a little water for a bit if I am too early, but this is looking like a 5th of 'c' at the moment.

EURJPY
Great start to the week with a move up through the 25 day FLD after an initial rejection overnight. Price is approaching the next rung on the green dashed Pyrapoint ladder and I am out of my longs here and working on other projects for the rest of the day. Catch up later.

Sunday, 18 August 2013
EURJPY - weekend summary
Thank you for the birthdy wishes and a great weekend was had around the Clifton area of Bristol. But always glad to be back to the charts. I think this pair may turn out to be my solitary trading pair going forward. I quite like the 24hr trading availability that this pair offers and seems to behave fairly, in my opinion.
 Not a lot to add to last week's commentary on this time frame. Price continues to meander around the 50% Harmonic Octave of the 'all-time high low' refection square, with the weekly momentum cluster ready to confirm in either direction. The EW count can change at any point, but for now, I think we are in 'b' of 'c' of 'b' before 'c' down in wave 4. No matter really, as I trade the intraday wave regardless.
 The 200 day Hull MA is turning down and price is currently under the 25 day FLD (pink). It is also under the 45 degree line (or at it, at least) in the bearish zone of the annual Gann reflection, but still holding above that 'all-time' Harmonic at 129.4042 and above the floor of the current square. It is a bit of a mixed bunch without some committed move either way. However, that 100 day low is still beckoning and any sharp moves up should be pulled back down pretty quickly in due course. For now however, the daily momentum cluster does not look bearish to me and I will follow this up in the interim, if that is where it is going.
 Okay, so I left this monthly square chart over the weekend without comment. I have overlaid the closest 'annual' and 'all-time' harmonic lines in blue and light gold for reference. The darker gold and green dashed lines are Pyrapoint calcs based on last month's high and this month's new low (as it has taken out last month's low already). Price does seem to be honouring the green dashed ladder at the moment. The 25 day and 12.5 day trend lines remain bullish and price has pushed through the 12.5day FLD (orange) but remains inside the 25day as per the last chart. So, some bullish action has been going on during this consolidation phase, but that 129.4042 'all-time' harmonic octave and the trough of the 12.5day FLD may pull down on price early week, However, the momentum cluster does look bullish to me and I think we will see price either 'cut' the pink 25day FLD above or if this entangled price action continues, then a push up into the 25day FLD near the 130.948 annual harmonic octave might be all we get. All in all, if there is no punishing move down hill, I am expecting that direction early week to be preparation for a spike high, before coming down into the pink trough building on the right hand side of the chart later in the week. We shall see, as ever.
Saturday, 17 August 2013
EURJPY
It is my birthday this weekend and I am away from the computer till Sunday night. It has been an interesting consolidation week for this pair, but I am beginning to like this pair for trading and it has been a profitable week overall. I will post this chart for now and explain my thoughts when I get back. In interim, readers might want to look back over the week and my commentary.

Thursday, 15 August 2013
EURJPY


EURJPY
Going my way again. Price has cleared yesterday's high and is now sat at the perimeter of yesterdays regression channel. A break here might see some acceleration, as per my earlier post. Note how price is right up against the 25day FLD - pink line in 2nd chart, having buffed off the 3day FLD in 1st chart. Cracking that may pave a bigger move than some are anticipating.


EURJPY
Not a lot to say on top of yesterday. I am expecting price to move down into the 100 day low in due course. However, price action seems to be suggesting it wants to go higher first and having pestered the 50% retracement line and the monthly bolly median, it has been crawling down the 45 degree line of last month's high low Gann square reflection. This chop chop suggests a 4th or maybe even a 'b' wave, so I closed my shorts at 130.00 yesterday and started to go long. A break of that 45 degree line and firm action above the daily pivot should see the 61.8% line tested but just maybe, price will aim for last month's high as well! As ever, we shall see, sure enough.

Wednesday, 14 August 2013
EURJPY
All shorts closed now and gone long - looks like a diagonal and a retest of prior regression channels. Diagonals come before final highs in 4th waves or 'b' waves and I'll take my luck at a rise from here after all this chop chop before the falls I have been looking for.

EURJPY
I have banked approx 2/rds of shorts which were in profit and covered the last proportion for now. Just not catching to the downside at the moment and the hourly momentum cluster getting tired. I am looking at the bundle of opening ranges since close of New York last night, surrounding yesterday's high and that looks like a lot of potential stops to me. Taking all the pressure off and hope for a move up to release longs and re-short.


EURJPY
Saw some bounces down after hitting the 50% zones yesterday (monthly Gann square and monthly bollinger) as well as the 162% of 'a' (if this is an expanding flat). There is negative divergence on the momentum studies and generally, I prefer a 5 count up from Monday's low to be completing 'c'. Could have banked shorts various times yesterday but decided not to. Hope I do not get punished for that! But, for now, nothing seems to be telling me to change the thesis, with a shorter term target of the 128.772-129.4042 zone to test the week's lows.

Tuesday, 13 August 2013
EURJPY


Subscribe to:
Posts (Atom)