
Friday, 31 May 2013
AUDCAD
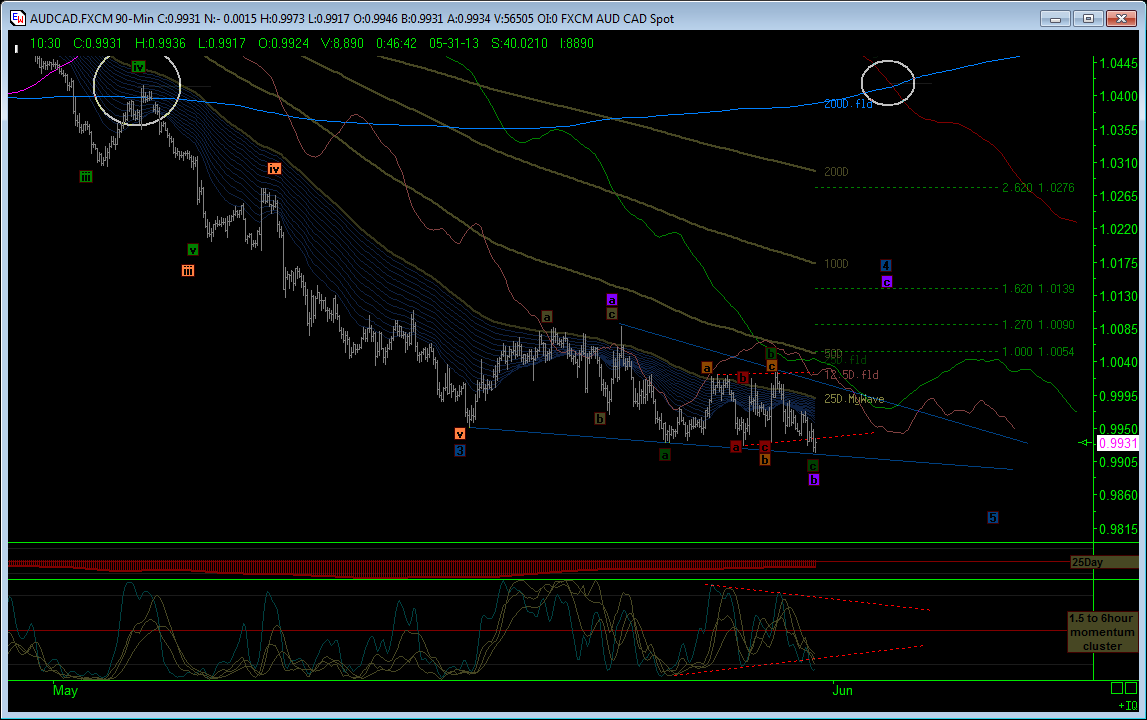
Nice move off the lows and seems to be sticking. Time to look at how the fld s have created a ladder to climb - will review this if the rungs get taken on.
AUDCAD
That leg down went too far to be an expanded flat in the 4th wave. Back to the contracting diagonal but with that being the 3rd in the 5th. If price just zips out of the top of the diagonal then so be it, although I am lost on the count then due to the structure as I see it. As long as up keeps coming, then I am happy whatever the count.

AUDCAD
Not quite ready to accept my EW counts on this yet. I am wondering if this is in fact an expanding flat in the 4th wave, trying to look like an ending diagonal, with the downward momentum causing the dropping action into the retracement. As such, we may have just be grinding out the 'b' leg of the 4th wave, setting up the stop losses above to fuel a retracement in the 'c' leg. It certainly counts better than trying to get that ED to fit. 
AUDCAD
Here is my count off the top. Could be that we are ending big red 'C' around here, or those legends need re-working into 1, 2 & 3 and we are due big 4. Plenty of upside when this foot completes, regardless.

AUDCAD
Outcome for me is no different, in trying to catch the updraft, but as feared yesterday, the count needed re-jigging. Going with this for now within the ending diagonal.

Thursday, 30 May 2013
Dow Industrials
Nice drop - have banked the shorts from earlier today and recovered the rest - so flat overnight and re-look tomorrow. Now if AUDCAD could do something similar, I could have an early weekend!!

AUDCAD
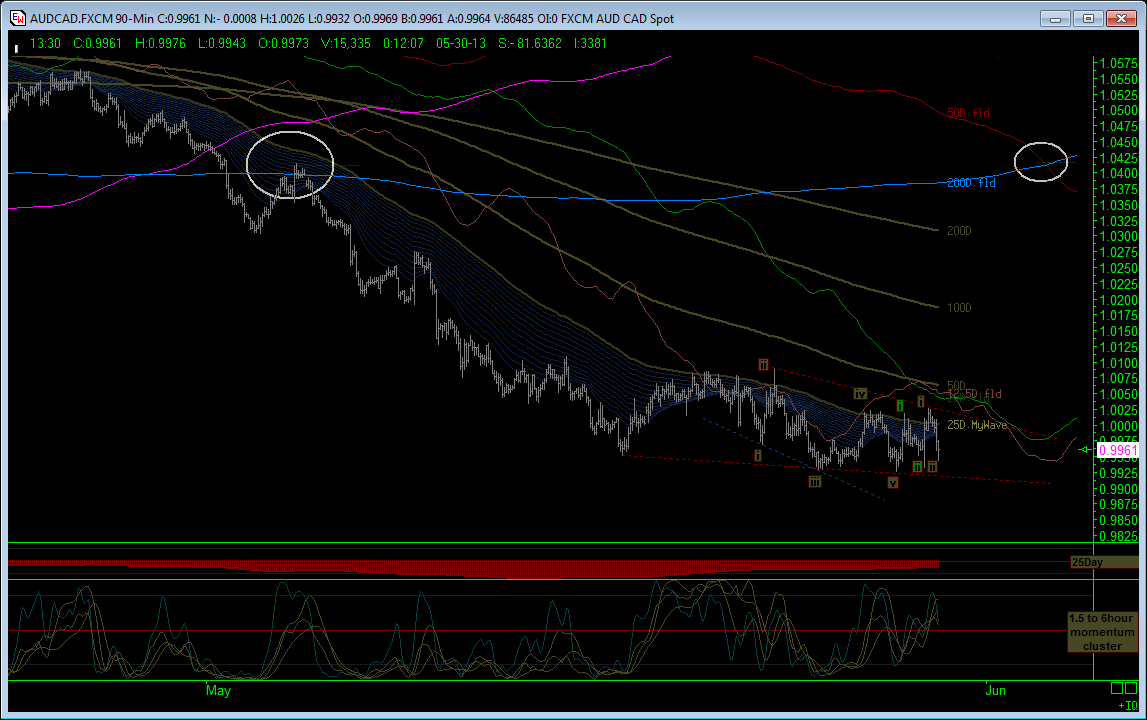
I am, not surprisingly, completely bored with this today. I have left the 1-2 count on for now, but it does feel like we are still in a diagonal and the momentum cluster is drawing one out too. I do not know what the count would be yet if we are still in the diagonal, although obviously corrective at this pace unless something happens spikey. We seem to be at the forefront of the next cycle up but unless it bursts through the perimeter, I'll be taking pips there and being grateful!

Dow Industrials
Well, if it is not going to be a triangle or diagonal, then now is about the time to come down. (I have only shown the triangle and diagonal counts for now on the bigger chart). I make that 5 waves up in a 'c' of an 'abc' with gap closed, as marked left and right by circles. There is enough retracement firepower in the momentum clusters to see something downhill stick but confirmation is the key - either way that is!!


Dow Industrials
Have added to shorts at the gap zone - see circles left and right. Possible count shown. 

AUDCAD
This is my count for the 'c' wave in that 2nd 'ii' I posted earlier. If so, rocket time. If no rocket, have to look at this again. Also note the white circles on the 2nd chart. Will cover this later if this move up gets going.


Dow Industrials
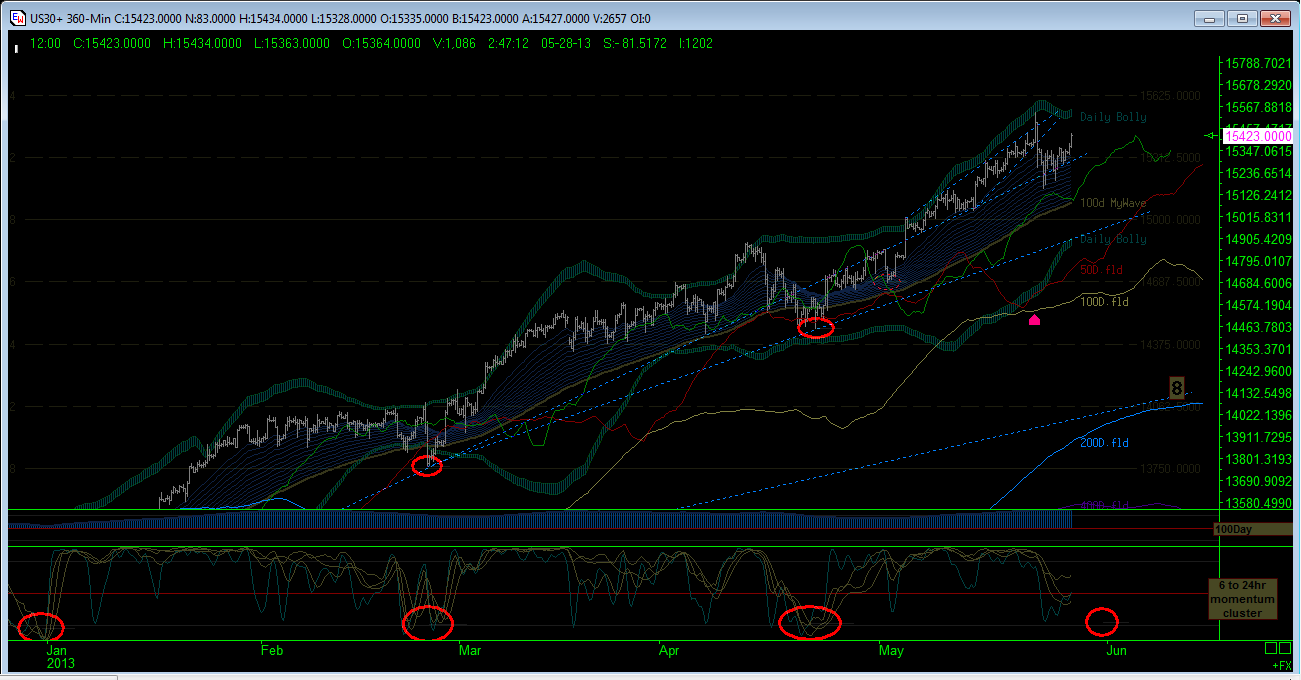
Here is the 100 day cycle chart. See how the underside of the trend line discussed yesterday has been kissed under the pretext of the very obvious triangle in progress. At this stage we do not know which one will win out but there is unfinished business on the daily momentum cluster there to the downside. This is why I am risking being naked short again as more downside risk here than upside gain.

Dow Industrials
For now, the triangle/diagonal options are looking good but the 12.5D fld is just above again and price would need to get through this to confirm. On my 10min chart I have a gap at about 15390 and this is where the 12.5D fld sits. What am I worried about: the possibility of 1-2s to downside, but that momentum cluster continues to suggest that the aforementioned triangle or diagonal should be kept on top table. I am however, closing my final 'short cover' for profits on this spike up, on the basis that AUDCAD seems to be suggesting that will spike up - if so, on recent form, that would mean the Dow would go down. I am light on the Dow anyhow, so going naked short at 15360 

AUDCAD
As long as the consecutive higher lows continue, this is the count I am giving it. I am emboldened by the bigger picture cyclic lows and hope for a thrust up to confirm. We shall see.


Dow Industrials
Not a lot happened overnight bar the sidewards motion. I have been looking for a 'b' wave and this could be it, if price breaks up. I have shown both the ED & triangle counts now which still seem to match the momentum cluster on this chart. If we do not see that spike up, then the odds of this being a series of 1-2s to the downside comes on the table. But for now, I have banked my net longs and gone 'flat' here until something kicks off in either direction. In the interim, I'll let my AUDCAD trade mature this morning.

AUDCAD
Overnight price action went a little deeper but count has held and now price is looking very potent right under the 12.5 & 25D flds. This is possibly significant as a 'cut' to the upside will come already sanitized by a simultaneous 'half & double' backtest of the fld sequence: that is 12.5 to 25 and 25 to 12.5. If the 'cut' is on, then as I have been trying to catch, the ride could be a doozy.

Wednesday, 29 May 2013

Dow Industrials
I have been having a good run: looks like the market is in tune with my thinking!? Having said that, this is where the mistakes normally occur, so looking to move stops up on longs as soon as a 'b' wave looks done to the upside. As I covered this morning, a triangle or diagonal looks about right, so a new high either way in due course. Hence my focus has switched net long instead of naked short, but I am not going overboard uphill given the proximity to something nasty lurking in the hallway. I'd prefer an ending diagonal, so that we can get on with the downhill bolt, but more likely we get the triangle and more procrastination at 15500-15510, me thinks as 'd' ends and 'e' comes back into the triangle body (if I have the count right - not shown on chart). Anyhow, a fair day with AUDCAD & GBPAUD and I am holding gains now on the Dow longs too. Catch up later.

Quick update
Have banked more shorts on the Dow and topped up longs on this move down. Also banked gains on both AUDCAD & GBPCAD which seem to be running with the Dow - if the Dow goes up, I'll likely lose my gains on these two. Decision made.

GBPAUD
Topped up shorts at 61.8% retracement zone. Fibo Targets below in green - 162% would be great for today!

Dow Industrials
If this low holds then we got either a triangle or ending diagonal building. In the latter, wave 5 is always longer than wave 3, which gives us a minimum of 15610 in my calcs. If it is a triangle, well then the 'd' wave (not marked) will hold at 15510 before coming back for the 'e' leg and then up. Given the very long term picture expanding diagonal has a top perimeter at 16000-16250 zone, I think the triangle is the most potent for a spike up. We shall see. My shorts are staying covered for now and I am not going to be premature if I can help it.


AUDCAD
Almost but not quite there yet. Given GBPAUD seems to be careening downhill, I do expect this do perk up a little soon. I am averaged in at 0.9962, so plenty of profit in here if can get going.

GBPAUD
Starting to look pretty darned good with 60 pips already to the credit: have moved to break even and letting it ride till the fast momentum study gets to the bottom of the subchart.

Dow Industrials
With that dip into the 'i' territory, the EW count could be revised as such. Perhaps that thrust down off the top was an 'abc' retracement 4th wave and here we have the 5th up in an expanding diagonal in the 5th. I really hope so as I have been bagging the shorts on the dips and now covered. A new high, drop the cover and re-load the shorts for the long ride home would be a fantastic June already!! Just thinking aloud

Dow Industrials
Covering my remaining shorts on Dow here and will reassess when momentum cluster is overbought again. Enough action on GBPAUD & AUDCAD to keep me busy today.

GBPAUD
Taking a nibble short here. 3 cycle lengths shown, all needing a nesting low on the momentum clusters. Looking for return to the perimeter on the first chart.


Dow Industrials
Banked 2/3rds again there. Momentum very sluggish and with the quickest momentum study looking tired already and without wave formation, I need some clarification as to what is transpiring. Hopefully short higher again.

AUDCAD
The legs seem to be in 3's. Still reckoning on ending diagonal pattern and with the 25day fld above as a 'rocket ship' target, I am adding longs in down here, looking for the ride uphill.

Dow Industrials
On the bigger 100day cycle picture, price is sat right on the trend line that joins the first two momentum 'nests' to the left of the chart. I have marked on the key target zones and that 'gap'. Just a little shove now.....

Dow Industrials
12.5day fld line being approached again. If it cracks, I am looking of the 25day fld (green) to be reached, although the 6.25D fld is now in the way at the previously posted 'diagonal' position.

Dow Industrials
Starting to look very much like a diagonal bouncing off the 50Day MA, given the progress of the momentum cluster. Current target would be 15230, if the pattern were to hold. I'll bank there, me thinks, unless something better occurs.


Tuesday, 28 May 2013
Dow Industrials
I'll be deleting all these EW legends if this move down keeps moving along as they will be of no need to me. I am no EW counter per se, but pleased I am!!

Dow Industrials
Well, if this is a throwover, the downside is going to be electric. No confirmation bar possible counts, so still hoping for now! 1min chart looking extended into that spike though.


Dow Industrials
This is the count I am giving to the 'C' leg up in the proposed ABC retracement following the fall from the top. I am nibbling in shorts on channel highs but hope for something downhill to clarify count.

Dow Industrials
The momentum cluster in the sub panels of my charts help to define the cycles within the trends and the cycle length is defined by the legends on the MyWaves; in this way, I like to think that I have a reasonable impression of where those cycles within the trends are bottoming. On this 100day MyWave chart (and therefore 100day cycle) the momentum cluster looks about half way trough its formation. This can be either a 'B' wave or wave '2' if the downward direction is re-engaged. Because the 100 day MyWave is still completely formed uphill, it is perhaps safer to assume this overall move off the top is corrective until otherwise proven. However, it does look like a reasonable move downhill in the same proportion as the first move, will take out the 25day (green) FLD, which would bring the 50D FLD (red) into focus. As this is in the same location as the daily bollingers and the 100day FLD (gold) near the harmonic octave of 14687, me thinks that this would be a great 'tester' of what will happen next. Context if you like for the momentum cluster bottom. I think a move down here that is not a spike, would have a great chance of rolling over the 100day MyWave and then we might have a top to reckon with.
Repostioning
I have banked some of that move up in AUDCAD and will wait for a pull back to re-look, as suspect 1.000 might want buffering from the top down now. Have topped up shorts on Dow to 2/3rds exposure now, lifting entry price higher than last week when I banked a large proportion.


Dow Industrials
No chart needed. 15393 is the 61.8% retracement of the move down from the top, to 15156. We are there or thereabouts. Will there be fireworks back downhill or not?
AUDCAD
So far so good. No additional counts for now - do not want to over analyse. All I want to see, is the move to stick in the upward direction and for the green line to get taken out when price gets there.

Monday, 27 May 2013
Dow Industrials
Reckon on 'C' leg well underway now of correction off the top. Looking to short again as high as can get.This is my working chart so apologies for being messy.

Subscribe to:
Posts (Atom)