Weekly Charts

A three dimensional approach this weekend on the weekly's. The first is an Ichimoku chart, which lays out the main technical discussion points. Firstly, that the EW count of a Wave 4 is either in progress or completed, from the base at September 2011. The move down from the top has taken the form of an 'abc' retracement in a different formation to that of Wave 2, with the 'c' leg reaching past the 123.6% extension of the 'a' leg. As such, this could be counted as Wave 4 completed or 'A' of Wave 4 completed, with this move uphill being 'B'. Price is thus far holding below the neckline (red dotted line), sitting inside the cloud having made a stab out of the bottom. The volume spike on the drop through the neckline and cloud was quite significant, I assume as stops were hit and new longs bought the low. Indeed, the stab down coincided with the Chikou Span pushing through it's own neckline and price action from 26 weeks ago. Price is also below Tenkan Sen and Kijun Sen, which although showing consolidation flatness at the moment, and are themselves crossed to the downside. These are also sat at the H&S neckline, providing heady resistance above. As matters stand, price is holding the bearish argument in my opinion, with that neckline the key zone. I am at least looking for a 'b' wave downhill, in this retracement up or the commencement of the 'a' leg of 'C' downhill, if this leg up from 8351 is coming to an end.

The second weekly chart shows the same 90 degree Pyrapoint steps up from the September 2011 low as shown in the first chart. Note that price has broken and is thus far holding the 9109 line as overhead resistance, which coincides with the neckline and the Tenkan Sen/Kijun Sen cross in the first chart. The trend band, MACD & ADX are all holding bearish here, but that red ADX line is way oversold, by holding the top line like that. What I would want to see is a 'kiss' between the blue and red lines to show the possibility of a completed retracement. However, the 8179 support line below is the 360 degree pyrapoint line from the September 2011 low, a significant degree to be left behind me thinks. There are no bullish formations to work with bar the volume spike in these charts, so I am going to assume that the oversold conditions on the ADX will be worked off with price action between these two lines: 9109 & 8179.

The third Solar Cycle study shows price holding below the pink dashed trend line, dipping in sympathy with the mid-point of the
11 year average Solar Cycle. However, it is still well within the confines of the blue regression channel set from the assumed 2009 end of the last cycle. Although the stochastic seems to suggest there is more work to do to the downside, my general impression thus far is that the green 'long' cycle mid point of May 2016 is going to be the crash zone, not this one. This would seem to suggest some renewed intervention in the markets coming, or not, as the case may be. But whilst that regression channel holds, I am still considering this a Wave 4 and not something bigger.
Daily Charts
The daily Ichimoku chart tells the same story as the weekly. Chikou Span is in the open and the Tenkan Sen/Kijun Sen cross is down. However, the stochs got oversold, the volume spike came in and it appears that whilst price is under the cloud, we are in a retracement. Given that neckline and the pyrapoint 9109 line, however, it would not surprise me to see a 'b' wave triangle or flat building underneath until the cloud is reached or maybe a diagonal formation into the 8179 support line, if 'b' is coming to an end. Either way, as long as the neckline holds (regardless of any temporary forays above), there is nothing to suggest a bullish stance for me here.

The second chart mirrors the 2nd weekly one. The ADX lines are working in for that kiss having been oversold, and the trend band has gone flat whilst waiting. Again, whilst that neckline holds, and all my other studies hold bearish, I am looking for downside price action to unfold, either in an ongoing correction or new declines. Given the oversold weekly ADX as discussed earlier, I am leaning more towards a larger corrective structure.
4hr charts
The 4hr Ichimoku shows price has pushed itself into a bullish formation, with Chikou Span and the Tenkan Sen/Kijun Sen cross, looking positive. But the position of the stochastic in line with the internal count of the move up, suggest a correction back down hill is coming, probably after a push up through the neckline.
The 2nd chart shows a bullish MACD & ADX, the latter having crossed up in this bullish move. I would expect that cross to be tested and this will coincide with the pull back. The trend band is holding bullish for now with the 50% retracement (down from 9892) at 9120 looking like a very viable target in the short term to push a little beyond the neckline and complete the internal count.
60min
The push up into the close Friday, combined with this weekend analysis, suggest to me that price should push up now into a final move for this wave from 8351. You can change the blue 'C' wave counts to 1-5, if that suits readers better, but this works for me. What transpires after that pop up will clarify the bigger picture, but I'll be looking for short positions on any new high and see where that takes me. Anything different to this layout will have me re-looking at the whole picture.


 Horrible wave. I got the 100% extension of today's 'a-b' at 9373 and the 123.6% at 9397. As suggested earlier, the approach to 9400 would tidy up the regression channels. I'll be out of net longs near there and trying shorts again, if it reaches up.


 So that is the new high I was looking for from the weekend's analysis and therefore I am now looking to get short. I am showing a 60min & 4hr chart with the same Pyrapoint lines at 45degree steps from 8351 as used last week. Given I am looking for shorts, I have added the diagonal support lines on the 60min to highlight any obvious rejections and breaks to the downside. It appears that a return to 8938 would provide a starter for ten on the short side and provide a red diagonal break. I am expecting negative divergence on the MACD on the hourly, so whether a break of 9089 would pop to 9240 first is not high on my possibility list, but holding that 9089 line now or later is key to getting down to 8938. The 50% retracement line at 9121 looks like a decent high to watch for. I think the battle lines are drawn; let the daily games begin.


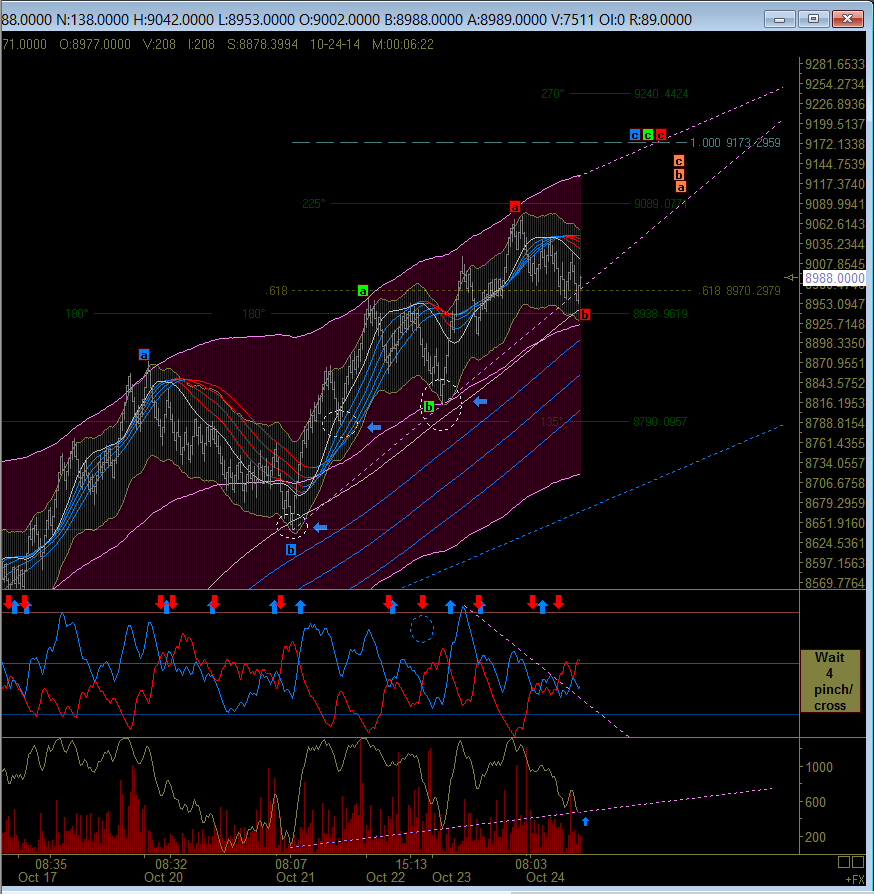


 Picked up some more longs there into 9030 - slow action backwards seems to suggest momentum remains up - will move to breakeven when hits 9089. I thought I'd post the 1hr, 2hr & 4hr charts along side each other. Note the ADX is bullish in all three, with the 4hr only really just crossing - that will need to kiss again in due course with the red, so that retracement is coming. However from where? Note that the 123.6% extension of blue 'a-b' on the 1hr chart is pretty much pip perfect with the 61.8% retracement from 9892 to 8351 on the 4hr. Price is at the regression median from the 9892 top on the 4hr, with the 50% retracement target a 'pop' above at 9121....pop and hold above would be bullish action again and likely to usher in the 61.8%. Note also the diagonal formation on the 2hr has popped and could actually be moving to the top of a parallel channel line, again at the 61.8% line. I just wonder, if it will now keep crawling up?


