
Thursday, 28 February 2013
EURUSd: 4.24pm
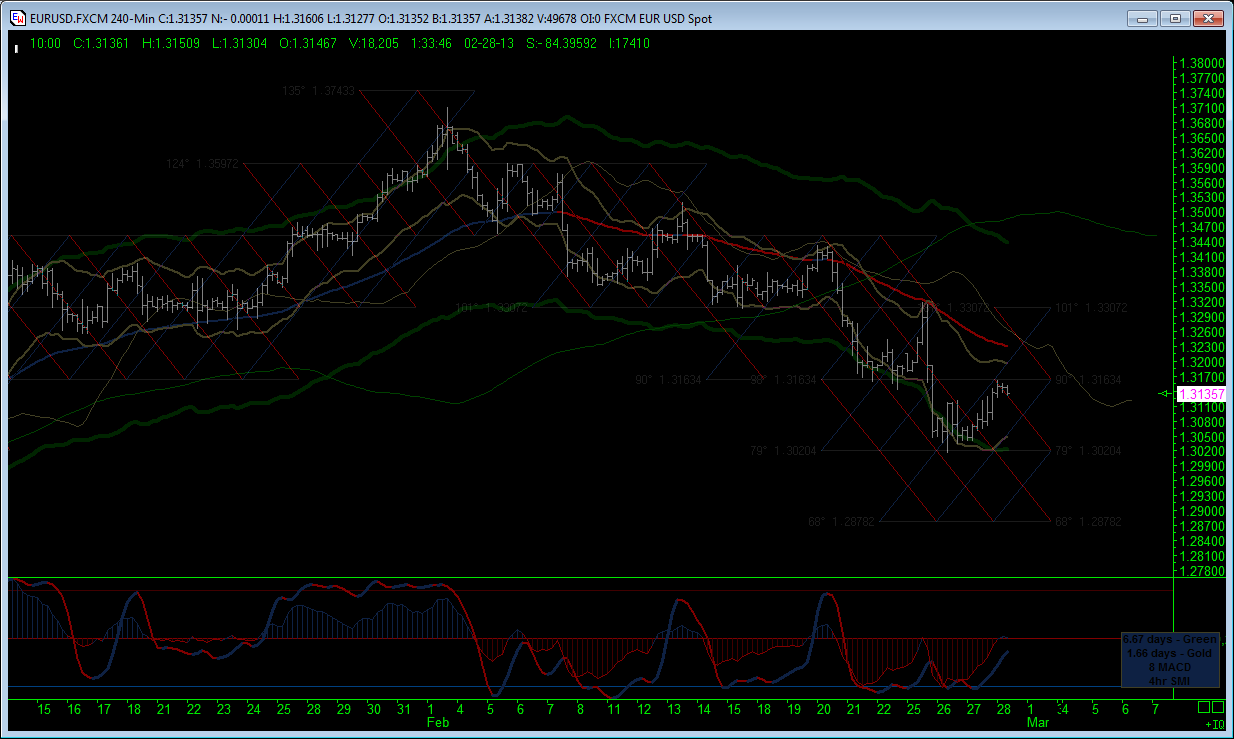
Blue support line has held so far - been a bit lary but no break, keeps my count and thesis alive. All or nothing and for now, all in my camp until it is not!

EURUSD: Speedline study
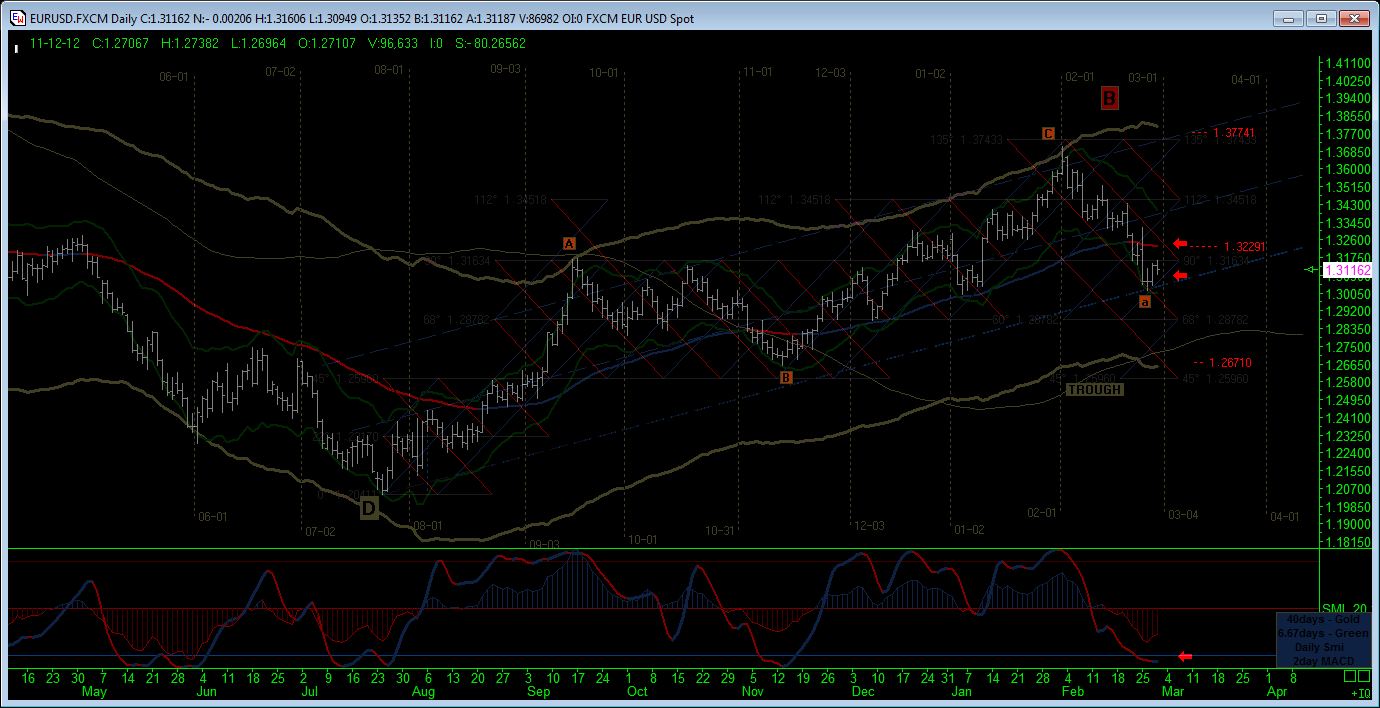
I am sure I am not alone in asking the question "what the hell is going on". Different indicators give different accents on the problem but which one is right? Of course, all and none: the market decides and we just try and capture the momentum. Ever since I happened across the 85.4% speed line (or Fibonacci fan line)whilst messing around, I have been drawing grids around them to capture the action and reactions. They are somewhat more predictive than Pitchforks because they do not need the 'b' wave to join together the axis, but I am biased. Here is an extract from the last 'C' wave of the corrective 'B' wave triangle using the grid down from major 'a' of 'D'. Now, wave 'E' in play we assume, with the first lighter blue channel calc'd off minor 'a' of major 'a'. The green channel is calc'd off the major 'a' in proportion to 'a' of leg 'C-D'. It seems to me that 'E' is not complete for the simple reason it is not in proportion to 'C-D' and appears to have no blow off 'trap the bulls' thrust thus far. Maybe I ask too much, but the green channel maybe just the job to keep bullish momentum pulling at this market with the combination of minor 'a' and major 'a' creating an ending diagonal to warrant the big 'B' leg being done justice. A drop down target still keeps the green channel in play too. Just musing the bigger picture. The Pyrapoint calcs here are off the 'C' top and match the Gann squaring off the 1.2041 'D' low. If that 1.3160 line goes to the upside - boom, me thinks!!


EURUSD: 11.28am
My-wave still in tact and 60min Bolly bounce seems to have contained an 'abc' retrace. 240min and daily DMAs up above price action on third chart to bed in some acceleration to the upside. First two charts are from earlier with EW counts added, bringing the weekend charts up to date. Note how the Speed line channelof the first 'a' wave up from 1.2041 still holds price - remarkable!


EURUSD: 9.51am
Taking a long at that diagonal perimeter. Only 4 waves inside thus far to my reckoning, so play a stab up and see what the fall out looks like afterwards - is this a leading diagonal?


EURUSD: 9.20am
Shorts closed. Nice pips off that earlier trade but not in the way envisged - MyWave is still fully formed to the upside albeit looking like a corrective one, so I am banking this stab down. Will see if get another entry a little higher than 1.3110 with MyWave a little more committed to turning. Alternatively, the My-Wave stays bullish and price breaks out above 1.3164 - I'll take what comes.


EURUSD: 8.26am
Short off the 1.3163 pyrapoint line. Will add notes after school run. "added": Given the formation of the Daily My-Wave and the lack of thrust at yesterday's 1.3130 pyrapoint line, it got me to thinking. I have re-worked the whole shabang off the 1.2041 low and it looks good - see grid allegiance on first chart all the way from that low and the resistance on way down from recent top. If the 1.2041 low is still running things, me thinks this has a good chance of being a 'b' wave down to correct that 'abc' up from 1.2041. As such I am very wary of the oversold SMi, although perhaps only for the bottom of the 'a' wave down from the top. There is a blue support line coming up under the price action on both the daily and 240min charts - key line me thinks. Will go either way but being led my the daily My-Wave in third chart which for now is ambiguous and has been all week.


Wednesday, 27 February 2013
EURUSD: 8.51pm
Closed longs out - Daily My-Wave looking all chewed up and corrective rather than the 'bottom is in', notwithstanding nesting of price envelopes and turns in momentum indicators. Might just need more time bedding in, but I'll stand aside tonight and re-look tomorrow.


EURUSD: 4.04pm
I make that 6 hourly candle attempts at this 1.3130 pyra-point line calc'd off the 1.3708 high. The one to get through should seal the deal and I have moved my target to 1.3274, just in case it spikes in relief, two levels, not one (so 1.3274 instead of 1.3202) and pushes the gold price band uphill, up to its purple DMA.


EURUSD: 12.07pm
Well, I think I am getting my bounce! Initial target 1.3200, just below top of gold channel and cluster of Pyrapoint calcs.


Tuesday, 26 February 2013


EURUSD: 5.24pm
Been automating all my settings so I don't have to keep manually updating everything. Looking for strong bounce in preference to collapse.


Monday, 25 February 2013
EURUSD: 4.27pm
No time to look at anything else today - this pair is very interesting. I have zoomed out a bit to encompass the whole move up from 1.2041 as in the weekend report. From left up hill, I have added the dark blue Speed Line channel off the first 'a' wave and then the green channel off the second 'a' wave. It is noticeable how momentum slowed down in that second channel but for now, neither channel has been broken to the downside, if one is to believe that these channels have efficacy - which I do, especially when you combine with the Pyrapoint calcs - see the top! I have rearranged the two potential downside candidates in dashed lines and different colours but key is that 90degree 1.31634 line - marked with red arrow. Add in the daily SMi position and one has got to give credence to that drop being a 'b' wave as a mimimum with more fathoming out of the journey ahead to come. We shall see. Take out the 1.31634 line and the bottom of the blue channel and different story.


EURUSD: 2.18pm
I have drawn in two possible Speed Line Channels off the two likely candidates for the 'a' wave down from the top. The first 'a' is usually the right one, and is marked in blue here. It has already had multiple touches and if this move up stays an 3 wave expanded flat, we could be dropping fast as noted this morning. Looks a bit short on time for me, so maybe a 'b' down then 'c' up, but with the weekly and monthly Trend Lines looking particularly bearish this morning, it could be hold on tight.


EURUSD 10.20am
Still looks corrective this morning, notwithstanding the bounce off the Pyra-point line as discussed Saturday. I have redrawn the calcs from the 1.3079 top to provide a refreshed lens to the price action. So far, the Daily Trend Line band is still in sell and price has bounced from the 1.3131 Pyra-point line. The Daily My-Wave in the second chart is still looking corrective in form, with the longer term MACD's under the zero line. Waiting for My-Wave to roll over to the downside and take the short term MACD with it. A breach of 1.131 could be very rewarding, although a retest of it would be fine for a Monday!


Sunday, 24 February 2013
Lines in the Sky: Sunday's GBPUSD Analysis
Following on from yesterday's first in the series of shorter Lines in the Sky reports, here is the Sunday's GBPUSD analysis. The navigation link on the right hand side of the screen will provide access to the rolling daily reports, replaced each week with an update one on the due date.
Saturday, 23 February 2013
Saturday's EURUSD Analysis 23/2/2013
Notwithstanding the time it took to write up the dollar Lines in the Sky report, the number of reads that it has attracted is minimal. Compared to the hits at the Daily FX forum, this has my head being scratched. I am therefore going to try something different and see if that works better all round. Each day of the week, I will write up just one asset/currency pair other than one day when I'll do two. These will be: Saturday(EURUSD), Sunday(GBPUSD),Monday(USDCAD),Tuesday (USDCHF), Wednesday(AUDUSD), Thursday(USDJPY & EURJPY), Friday(Dow). These will appear in the Lines in the Sky report each day in a rolling list to provide weekly access to prior reports but will be replaced each week on the due day. I think I have a repeatable format that is sumarises my 'top down' analysis process and if the hits go well, I'll move onto trying to do a voice over in due course and then maybe a live webinar if there is demand for it. For now, here is the Saturday's EURUSD Analysis.
Thursday, 21 February 2013
EURUSD: 6.21pm
Taken half a day to create but here is that 2hr DMA testing the 'trough', as covered earlier. If price pushes through that trough, it is also the regression channel perimeter from 1.2041. A lot going on behind the scenes me thinks, notwithstanding the apparent calm.


EURUSD: 5.19pm
Now that the DMA of the trend line band has been 'cut' (purple), I have drawn in the next couple of rungs on the ladder - these being double the time frame (light blue) of the trend line and then double again (gold). By looking at the peaks in the future, one can hazard a guess as to when retracements might occur. Interesting to me is that they would fit a decline in the same shape as the ride up from 1.2041. Just musing.


GBPUSD v EURUSD: 2.21pm
I think the legends on the charts say most of what is needed. The key is that there is no proof in the trend line formation that this move in EURUSD is corrective off the top as yet and the supposed 'wave 4 or b' in the downdraft of GBPUSD, does not show any corrective formation either. Nothing is guaranteed of course, but all looks rather bigger in degree and impulsive to the downside, irrespective of interim retracements.


GBPUSD: 1.54pm
The ongoing series of diagonals in that decline this past couple of days seemed very purposeful and rather than continue with trying to go long, I am waiting to short this higher up to recoup my 'investment!' or re-enter long near that low this morning if price returns to test it. The trend lines are bearish on both weekly and daily time frames and most of the 60min bolly on the 2nd chart has just about got price above the pyrapoint line 1.5241. Any gains from going long might be secured by a stop just under that line. I expect sidewards action across the regression channel with a possible rise into the 1.5552 pyrapoint line, which looks about where the 8hr bolly band might get to. Will only short if the trend lines remain red.
EURUSD: 11.15am
Price is now at the regression channel perimeter. I had assumed an 'b' wave up and then 'c' down to here, in the weekend summary, but the persistent fall of GBPUSD has me wary of closing shorts too soon. This could of course be nested 1-2's and I am using the 2hr displaced MA for entry and exits (orange line) around pyrapoint calcs (green lines) and for now momentum of price action and the 2hr cycle are just plain down. If price cuts the 2hr DMA, it will create a trough - this trough will then get tested. A break up out of that trough gives you an higher low for an aggressive entry long(as the trend is down for now) but more importantly a relatively tight and mechanical exit strategy.


EURUSD: 8.54am
Price makes it to the main trend line off 1.2041. Shorts are at breakeven from the last pyrapoint line and looking for a break here to make it down maybe 2 more lines at 1.29878. Catch up later.


EURUSD: 6.00am
In honour of GBPUSD continuing to extend its decline, it is interesting to note EURUSD's cut of the first dotted trend line and the main one from 1.2041 now in its sights. Trend continues to be down and the 8hr bolly's are currently failing to hold back the tide.


Wednesday, 20 February 2013
GBPUSD: 8.41am
Fading this diagonal has been a little testing from a time perspective but my long yesterday deep into the end zone is hoped to cure all. Looks like a leading diagonal and retracement on the short term chart. Just need D1 to finally crack and we should see some fireworks worth banking.


Tuesday, 19 February 2013
GBPUSD: 4.35pm
Stretching very tight me thinks. First chart lays out all the D'lines (1-5 days, 2&4 weeks). We just bounced off D1 this morning and failed the retest for a new low but they are all lined up above now and there is no daily trend at the moment - see second chart and completely flat trend lines. These look like tramlines when there is a trend. Add in the SMI divergence on the 2hr chart and I'll be buying some more of this bolly stretch.


GBPUSD: big picture
Just another quick look at the daily chart and yearly My-wave. The SMi is oversold and we have an acceptable EW count on the earlier charts to follow any daily My-Wave back up. The light blue line is the monthly Displaced trend and its peak sits at the 85.4% speedline (dashed blue) and the 50-61.8% retracement zone. This is a strong initial target for price action and of interest to me in discerning which of the two 'big' counts may be right, is the reaction to the latest decline, especially in that area. Still 400+ pips away, so looking forward to getting as many of those if not more with repeating trades, before having to assess what comes after. Just need to be careful there is not another decline coming first!


USDCHF: 10.51am
Looking like shorts maybe ready to go on here. Price up into the monthly Displaced MA peak in what was counted as a 'b' wave up in the weekend report. Daily My-Wave (green)looking very corrective around the previous high and the 0.9248 pyra-point line, with the daily trend line red for sell and negative divergence on both the SMI clusters on the two charts. Small risk for getting into 'c' down.


Subscribe to:
Posts (Atom)