
Monday 30 September 2013
EURJPY
EURJPY
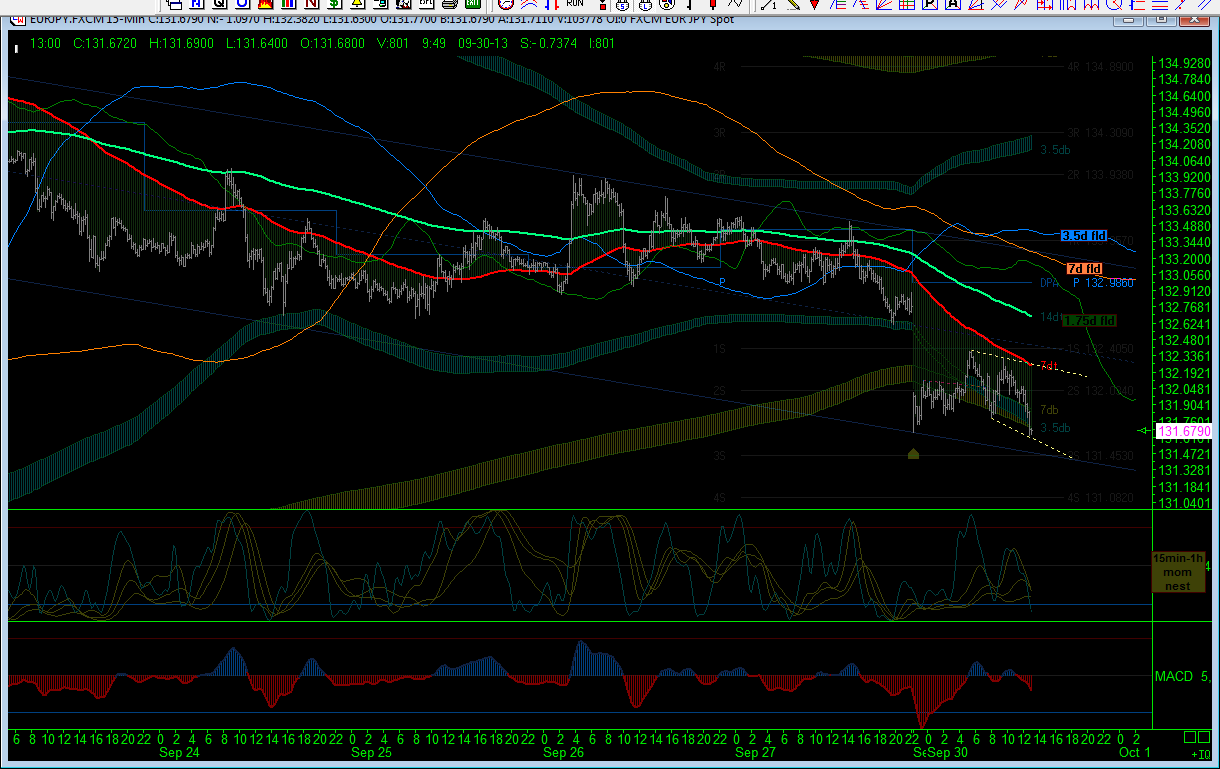
That was a lot of energy. Longs closed at Daily Pivot. If this is a wave 2 up of 'c' in an ending diagonal, we should get one hell of a thrust down. Fingers crossed.

EURJPY
Well, give a couple of pips, that is the gap closed - still reckon that pattern looks like an expanding flat, so expecting falls here. We shall see.

USDJPY
It is the look of this pair and the 100% a=c extension target and time slice (blue dashed line to right) that along with the EURUSD has me on the defensive with EURJPY. Nothing here to suggest we are not going to get a slicing ending diagonal!

EURUSD
Looks like the count is working out just fine from Friday. Approx 1.3400 for the 'c' leg in wave 4 for RURUSD, and that will be roughly where I'll let my EURJPY shorts off the round trip. My target for EURJPY is 140.00, so getting in as low as possible will be a year changer for me, if it comes off.

EURJPY
Re-covered my longs again on that move out of the proposed diagonal. That now looks like an expanded flat for wave 4, now wave 5 down. Don't know but got to go with hunches sometimes and they have not been too bad of late. The London opening range high was 132.03, which was the highest out of Asian, London and US, so I'll see how any pull back reacts to that thrust through there.


Dow Jones $indu
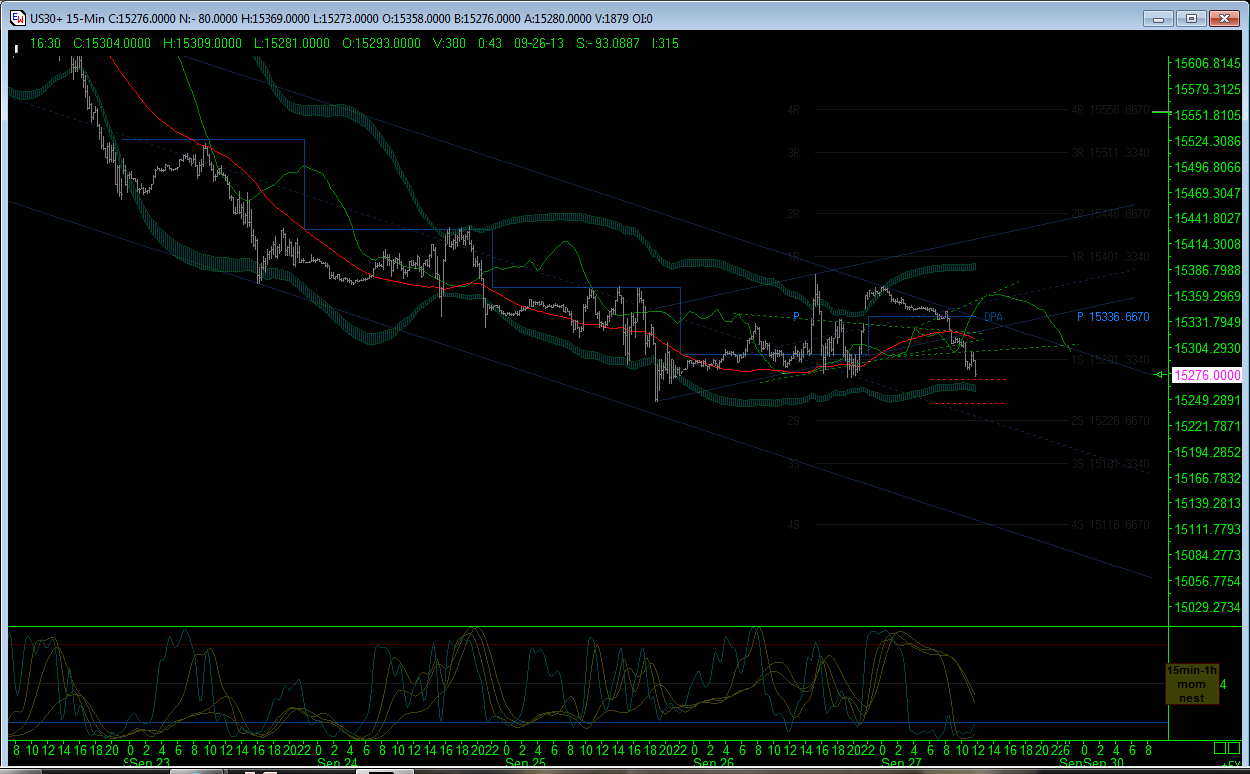
Following on from the weekend report, the 61.8% retracement line has been met and it is possible that we may see a little more gumption for a return journey to clarify the count. Of interest now to me, is whether the count is correct at 1-2 already or whether the 2 was in fact a 4. We shall see on the strength of the return.

EURJPY


USDJPY & EURJPY
Lining up in their respective triangles? EURJPY soon to be given permission to get on with it?


Sunday 29 September 2013
EURJPY
Busy day walking on the hills in probably the last days of sunshine for a while. So no full weekend summary for EURJPY (although I have done the Dow version - see right of of screen and last post) but here is a reminder of expectations as we get going. I had been hoping for a decline into the 'c' wave on Friday, but got frustrated at the lack of action into the early evening and covered my shorts. The gap down tonight looks like I got that wrong, but slept like a log this weekend and that is key too, I think - poor reward tonight though!! I'll be looking for a bottom tomorrow morning to buy into if price action looks right.

Dow Jones $indu Weekend Review
 I'll begin this weekend by revisiting the Cyclic Phasing from the 2009 low. I have found the 100 day cycle (blue bars in sub-chart 1 and blue arrows in main chart) to be relatively stable and uniform. The number sequence 1-4, then providing easy at a glance phasing for the 200 day and 400 day cycles too, without having to draw additional bars - well I like it! I wanted to show this wide angle shot to emphasise the fact that we are in the 12th 100 day cycle since 2009 low, which amounts to being the 1200 day or 54month cycle due date for a low. These are big durations of course but this is the last 100 day cycle, so it can't be that far out can it? Based on the 11th cycle low, this 12th one should be the 23rd January, but I'll just take 'anticipated downward pressure' for now, out of this. Of interest is the 'cut' of the 400 day FLD in September 2009, marked with red arrows, and the subsequent touches since, also marked with red arrows. It seems to me that a test of this line might coincide with the 54month low, although a 'cut' to the downside might be just a little more interesting!!


Friday 27 September 2013
Dow Jones $indu
My longs are looking good already on the Dow off that low. Now just a teaser: most of that leg down was like pulling teeth. The second part of the leg, I guessed correctly as an expanded flat. Now, everyone including me was looking for an thinks they have found an ending diagonal and thank you very much too for the gains. But what if this horrible price action has actually been part of a larger expanded flat in leg 2 overall, where this leg down was in fact the 'c' leg of 'b'.Just saying because the internal expanded flat could be a fractal of what is to come. I am not going to mark it up, but I'll not be closing my longs prematurely, nor trying to catch a wave 5 down!!!!!

EURUSD & EURJPY
Just not shifting today. Have banked small gains on EURUSD from earlier today and covered the EURJPY going into the weekend. If I get a spike up on the Dow, I'll use the profits to clear everything out and start Monday fresh.

Dow $indu
Trying to buy this possible leg 3 bottom in a contracting diagonal. Momentum and PA suggest this is good place to look, anyhow.

Dow $indu
Possible contracting diagonal - looks like I banked on the nose there. I'll try and buy the 5th at about the 61.8% Monday I think.

Dow Jones $ Indu
Just closed longs there at 15205 - reckon this is in fact the ending diagonal I was trying to catch on Wednesday but got shafted - not this time baby! Leg 3 has a little more to go if it is leg 3 and then up and down again. Got to go pick up the kids, so banked that and see if I can catch something else later.

Dow $indu
I have to keep checking my data feed, this PA is almost non-existent. I got my shorts covered at BE, so whatever will happens is fine by me, but I'd prefer down to the 61.8% tonight to cover there instead! Nothing happening with opening range yet, so 2.30 GMT it is.

EURUSD
a=c for 'B' wave looks still good to me. Looking to short this on lower high. Very tight stop, enormous reward ratio if turns into 'C' down..... or more.

EURJPY
So, no surprise this has got itself stuck then. EURUSD rise this morning is counteracting USDJPY's fall. But, the price action is under key support, that it spent the lat two days getting to. So I am hopeful, that the EURUSD count will prevail and that it is a 'b' wave and not wave 5 up. If it is wave 5 up, and EURJPY can ride it out ranging, then I'll still get my drop to the bottom of the regression channel off the 134.935 high.

USDJPY
It is taking its time, but the 'c' of 'E' count I have been trying to blow embers on seems to be catching this morning. Again, if the EURUSD can stop messing around with the 'b' top I am assuming it is finishing, then together these two pairs should get my beloved EURJPY downhill too.

EURUSD

EURUSD
Price is back at that break out point again and trying to ruin my EURJPY shorts following the Dow (or maybe its all going up!). Could be a bullish count instead of my bearish one but I keep looking at the Dow and thinking, down for EURUSD would suit me better!!

Dow Jones $indu
EURUSD
So far, so good here with what looks like a useful reversal to push down into a 'c' wave at least. Hopefully this will continue to put downward forces on EURJPY & the Dow which is what I am short in.


Dow Jones $ Indu
So that collapse yesterday occurred exactly at the lower threshold of the big gap up from two weekends ago now. I thought it might be a 'b' leg down but this action since suggests it might also count as an expanded flat in response. The dribble down of course does not yet fit with a 'wave 3 is underway', but if my currency pairs do print a 'c' wave down, then some softening here in' risk off' trade may work out fine. I'll stay short the Dow and wish for something chunky, although I very rarely seem to get a clear run with this index and it may just have been a 'b' leg as discussed.


EURUSD, USDJPY & EURJPY
These 3 pairs seem to be following the same basic premise: are we about to get going proper on this 'c' leg down or is there more procrastination on the cards, or am I just wrong! I'll just post the EURUSD count this morning to keep matters simple. I am looking for all 3 to drive downhill and set up the next leg higher. At the same time, I'd appreciate the Dow doing the same but me and that index seem to have an ongoing love hate relationship (I'd love to love it but it just keeps hating me!).

Thursday 26 September 2013
Dow Jones $indu


Dow Jones $Indus
Well that Ending Diagonal did not work, but this rise up into the weekly pivot band is looking very 3 wavy at the moment and I wonder if something harder down ill is coming. I have taken the rise as an opportunity to lose my longs and see how the short side takes care of me and will worry about the possible count later once the next drop is in.

Dow Jones $indu Elliott Wave
I keep looking at this blessed chart and I am shifting the count again. The target at 15220 ish is still the same but given this slow start, I am going back to it being the 5th in 5 not 3. If you look at the MACD on the larger chart, it seems that there was a sneaky wave 4 in that mess earlier in the week that I thought might be a 'b' cluster. Anyhow, I'll chance my short cover off near 15210 in case we get deliverance northbound from there.


USDJPY
All the counts from this morning look to have nailed matters pretty well. Here is the updated count for USDJPY. The low in this 'c' of 'E' is likely to be the turning point for EURJPY too and the 'c' leg in the EURUSD retracement, so plenty of corroboration available. Got me thinking on how far the Dow has got to go though....uumm.


Dow Jones $indu


Dow Jones $indu
Not reckon that rise up is impulsive although it may become so. I have had another go at counting this drop and as ever, the longer it goes on, the clearer it perhaps becomes. I have shifted the count a little to accommodate a bit more room for a 5th to unravel, to fit with the Yen calcs from earlier. I have covered my longs here in case of a sharp 5th wave spike for 'Claims' day and hope to bank those and uncover my longs later today or tomorrow.

Subscribe to:
Posts (Atom)