
Tuesday, 30 September 2014
#dax $dax
Managed to retrace to between the 61.8% and 76.4% of yesterday/this morning's move, which suggests it could have been a leading diagonal in 'a' wave this morning and then the 'b' wave back, but already overbought on the 12 & 24pip range bars studies. Not chancing good gains today and flat again for the night as price comes into yesterday's high at 9506. If it is a 'c' wave up here, there should still be an opportunity to buy weakness tomorrow...or maybe not. Enough for today.
#dax $dax
What a slow day so far! VWAP looks to be holding intraday, but another push up into yesterday's highs, the daily pivot R1 and the weekly half pivot 1-S may be enough to fund a retracement back down. Looking to add shorts nearer 9500 if opportunity arrives.

#dax $dax
Possible leading diagonal on the 12pip range bar study - need to keep an eye on the reaction lower, especially into the weekly pivot line at 9391. Only downside momentum softening at the moment, but this could be an 'a' wave in a retracement back up or part of something bigger. Just thinking aloud, in case the next move downhill does not push on past yesterday's low to the monthly pivot, which could be construed as somewhat bullish.

#dax $dax
Price is still mooching about the daily open and the 12pip range bar study shows stochs cycling higher for now. I am flat again having sold into that poke down and hoping for another test of the 9460-9490 zone for another go. However, that is the daily VWAP holding price up, which has not veered from yesterday at all. If price presses down through the trend line, 9324 is the goal.

#dax $dax
Unless something striking occurs in either direction, I continue to work this low forming as an opportunity to see a bounce on the 4hr to daily stochs/charts. There are a number of targets below, with the Monthly Pivot at 9324 an obvious goal for the market. The 61.8% retracement of the move from 8902 is at 9278, another worthy contender. As I said yesterday, nearer 9300 is probably a safer place to look for trend changes. Catch up later.

Monday, 29 September 2014
#dax $dax
Volume picking up here into 9420 on the 12 pip range bar study - nothing broken to the downside as far as I can see, although momentum looks corrective for now. That is my VWAP band on this chart and nothing positive about that this evening. 60 pips up from the lows of the day and happy to cover longs here and go in flat overnight. Re-look at everything in morning. Thank you for reading.

#dax $dax
This is the updated 8hr chart from the weekend report. Not arguing with those stochs, although the pink dashed line needs a clear break to suggest the EW count is a runner. If it did break, that might suggest my 'diagonal' possibility is worth more serious consideration. Do read the weekend report for more info.

#dax $dax
Price is now nearing the 100% extension of the first drive down from 9892 and already at the 50% retracement from 8902. Lightening up on shorts and wait for a reset across the momentum studies as all timeframes to the daily chart are oversold. Catch up later.

#dax $dax
Quick reminder from the weekend report: price is testing the regression channel lower perimeter up from September 2011's 4962 low. That is a fair length in time to make this line in the sand of worthy note. We are also at the cross over of the regression median line down from 10048. I do not know if we are going to push down into a zigzag or pull up short and maybe move sidewards in a large triangle, but if this zone breaks, I'll not be fighting it downhill, until price bottoms out. For now, all the MyWaves from the weekly chart to the 15 minute are all red on my screens, so maybe 9300 would be an interesting/safer place to look at price action for anything northbound building, rather than being too early.

#dax $dax
There is the pull back but looks like the 'a&b' of the last drag down is in, so a 'c' leg for this wave at least, is coming. As per weekend report, the 9350 zone looks a useful place to look for changes in trend to the upside. Will try and stay short into 9375 at least.

#dax $dax

Saturday, 27 September 2014
#dax $dax Weekend review


Trade well everyone.
Friday, 26 September 2014
$dax #dax
Looking like a flat to me to extend the retracement in time but not distance. I got equal legs at 9553 but price is/was almost there and the stochs on the 12pip and 24pip range bar studies are looking tired now. Not expecting much to happen tonight but positioned net short just in case. Would be happier nearer 9400! Catch up over the weekend.

#dax $dax
The 38.2% retracement line from 8902 to the high, looks to have slipped into resistance mode after a full frontal attack this morning. Price keeps jabbing at it, leaving the VWAP on the 2nd chart, looking flat fro now. A break of this morning's low may see the 50% at 9397 attained, which will have me banked and out for tonight. Let's hope the market has not already shut up shop!


#dax $dax
9546 may be all we get northbound. The pink speed line off the initial low to 'a' wave this morning has been broken for a second time and price is pushing a flattish MyWave, which itself is sitting just above the opening price and today's 50% line. Could be more consolidation into the 9600 zone but I keep trying to sell the 5pip channel tops, for a 9400 target.

#dax $dax


Tuesday, 23 September 2014
#dax $dax
Following on from yesterday, price has now made it to the 76.4% retracement of Friday's high and equal leg zone for a 'abc' back. Obviously, the 9587 low is the cut off point, but looking for longs out of here to take out 9900. I am in meetings today, so catch up tonight.

Monday, 22 September 2014
#dax $dax
MyWave is behaving very well today! I am torn between a zigzag down to the previously discussed 76.4% retracement of Friday's low to high at 9658 or a flat in the ''b' wave to tag the 61.8% above, first. With price back under today's open, Friday's low and the daily 50% rolling retracement line, I have held short with cover above today's high and hope for the former.

#dax $dax
Price has made it back to the 38.2% from Friday's high but the momentum looks tired here on the 12pip range bar study, where MyWave is bearish and the stochs are showing 7 waves up from this morning's low. Any more upside is going to need a reset in the short term, but risks catching another leg lower with this set up, if price makes it below today's open at 9753 and Friday's low of 9778. I think it is going to be a 'b' wave here in the retracement zone as suggested earlier.

$dax #dax
Not very impulsive out of the 50% zone of 9739 this morning. Might be worth looking for a 'b' wave pull back here to 9811-9830 before another leg down to test that 9587 low a bit closer. The 76.4% retracement of 9587 to Friday's high sits at 9658, so maybe up enough to make that target as a 100% extension. Will see what the move up looks like nearer 9811.

#dax $dax
Price has reached the 50% retracement zone off 9587 - 24pip range bar stochs are oversold but need to see price action move above Friday's low at 9778 to suggest the upward channel is starting to bite.

Friday, 19 September 2014
#dax $dax
Lots to do this weekend, so this chart will have to suffice: 7 swings is equivalent to 'abc' for 'A', then B, and the 'abc' for 'C' in EW terminology. Can only follow the daily waves but looks pretty. Have a good weekend everyone.

#dax $dax
Running out of trading time today by the looks of it. Price continues to stall at the 9800 zone, with the 38.2% retracement from the 9587 low at 9775. However, the hourly stoch study is looking oversold with the RSi holding bullish and the regression channel too. I have doubled up from the current low to high, using the possible 'b' wave low, although a little shallow; a 100% extension gives us a new high at 10078, so a break of the pink trend line could be swift there-on-after with a clear goal insight.

#dax $dax
That 9805 low seems to be holding: I am risking shorts banked with cover back in place under 9803. A ride into 9917-9964 would be the 100%-127% extension of wave 'A' up if 'Wave 'B' was that tiny little thing marked by the arrow and stoch drop yesterday. Looks blimming weird to me but the lull was there and this has been Scottish Vote week. Look to bank longs and be out of all trades if price can make it up there tonight. If the cover gets taken, I'll assume we really are having a proper correction from the 9587 low.

#dax $dax
Minimum level of pull back there at 23.8% has my 12pip range bar stochs oversold. If MyWave at this degree is going to hold then, we might see a push back up again to test the top. I'll sell the next overbought on this degree if the top holds.

#dax $dax

 Well, that was emphatic and put pay to any bearish count. I have been looking for a retracement in conjunction with the hourly cycle, but it has not appeared yet. I'll only feel safe going long when that cycle bottoms out and I can compare the risk to the 9587 low, but I guess I am not the only one! The next line up in the grid on the 4hr chart is 9903. Perhaps something corrective will begin there; if not looks like the top is at risk.
Thursday, 18 September 2014
#dax $dax
A lot of bullish counts going on in blog land. Could be of course, but with my 4 hr stochs overbought like that, the ongoing negative rsi trend and the regression channel location if fixed to the 10048 high and well.....might be worth considering shorts! MyWave has not embraced this move up thus far, with the study all compressed until now. Until my 1 hr stoch study unwinds from overbought (not shown), it is a bit of a guess, but no place for new longs in my opinion unless the 9788 high is taken out. Looking to short whilst that 9788 holds. I'll redraw the channel if it does not. Catch up later.

#dax $dax
Following on from yesterday's post, price has now made it into the 76.4% retracement from the 9788 high and the hourly stochs & rsi are showing negative divergence. Looking to short from up here until that hourly stoch is oversold.

Wednesday, 17 September 2014
#dax $dax
Hourly is overbought now and overall, I think price is trying to make it to the 61.8%-76.4% retracement of the drop from 9788, which gives us a target of 9713-9741. I got pipped this morning at 9696 due to the spread on my longs, so I am slightly biased in wanting to see those higher numbers to let them go at a profit. Unless there is a stab higher to take out the 9788 high, I am looking to be short if the opportunity arises, but higher please.

Tuesday, 16 September 2014

#dax $dax
 Managed to pick up some longs at yesterday's low but have banked that now and gone flat into today's 50% rolling retracement. I was hoping to lose longs higher up to go short, but so far price is rolling down, so if lows come first, I'll swap around to losing shorts instead. For now, will wait for hourly stochs to hit oversold or overbought to decide.
#dax $dax
This is how I am counting it for the moment... got my cover under yesterday's low and hoping to lose longs and be naked short at the 100-127% extension (9714-9739). We shall see.

#dax $dax
 Very slow afternoon yesterday and I have to assume the Scottish vote is playing on the market as it assimilates the vote swings. Generally, slow markets are 'b' waves in my experience and really slow action can be 'b' waves inside 'b' waves. As such, I suspect we may see some more upside before this one hour overbought condition unwinds to test the previous 'b' high at 9746. I have nudged slightly long into 9650 but only just, as my 15minute cycle is oversold this morning (not shown). Looking for tests at resistance lines 9684, 9706 & 9729 to see what transpires.
Monday, 15 September 2014
#dax $dax
The jump up this morning went according to plan, but looks like another connector to me (b or x wave depending on what you want to label it). With the hourly stochs overbought and the underlying MA band bearish (same subchart as stochs), I am looking for a test lower as explained in the weekend report, into the 9500 zone. Buying down there should fit with the 4hr chart becoming oversold again and may see the next leg higher to test the daily chart's pink dashed resistance line - see weekend review.

Sunday, 14 September 2014
REFM projection for the next 3 days

Saturday, 13 September 2014
$dax #dax Weekend Review
Relativistic Electron Forecast Model for Saturday 13th September

The model forecasted the Dax's behaviour last week pretty well, suggesting that I look for strength to sell. As I mentioned yesterday, forecasts of rises in high-energy (relativistic) electrons over the weekend had me looking to close shorts early and indeed, Monday's forecast looks bullish for the Dax. If the market does not gap up, or even better shows weakness from the open, I will probably be looking for opportunities to buy.
So what does the Technical Analysis look like?
Monthly Chart:
 I am working with the Elliott Wave count that price is currently in a 'b' wave in wave 4, from the 2009 low of 3588. As there has only been one wave down in the overbought stochastics since the high, the distance to the Ichimoku cloud, the bottom of the volatility range and the monthly 200sma, I am using the pink dashed resistance line as a potential rejection zone in the shorter time frames for wave 'c' down in due course, of either wave 4 or wave A of 4.
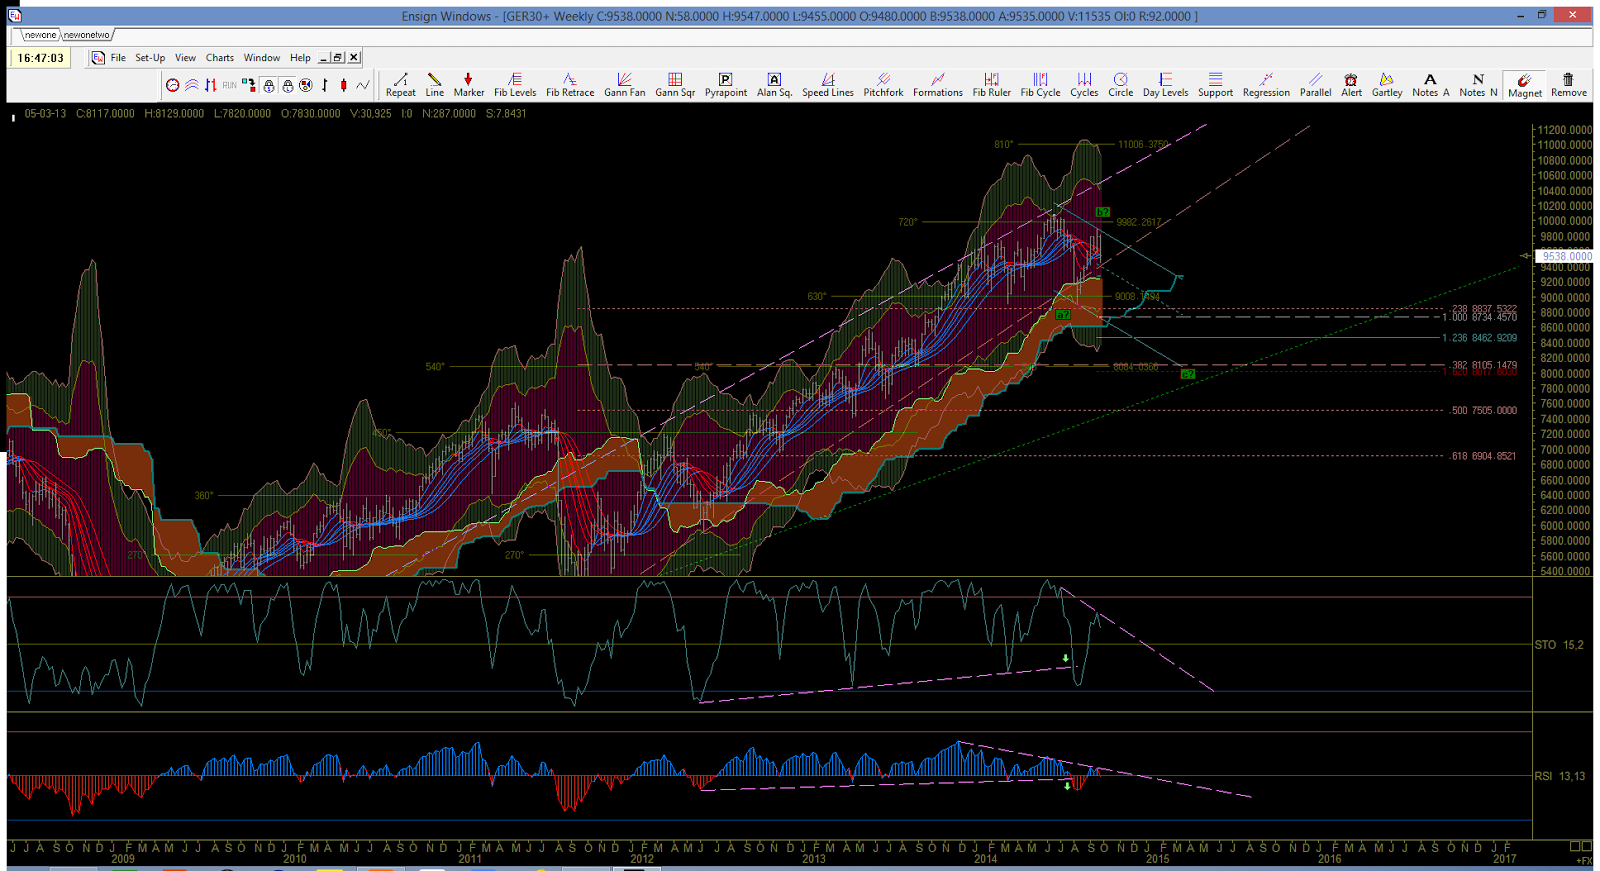
Weekly Chart:

Following a retracement of the 23.8% line from the wave 2 low to the wave 3 high, price has made it back to the pink dashed resistance line and the gold dotted median line of the volatility channel. Price had also bounced out of the weekly Ichimoku cloud and the linear regression channel perimeter. However, the RSi on the weekly chart is still negative and MyWave in the main chart is still red for bearish. The stochastics in the first sub-chart have followed the rejection from the 23.8% zone, but the trend bands in the same sub-chart have just turned down, despite the pull back. The weekly chart seems to be rolling over and fits with the 'b' wave of wave 4 or A of 4 from the monthly chart. However, this is big picture storyboarding and of little use to me intraday, although the higher price action pushes into the pink dashed line, the more concerned I would be with taking bullish positions, and more likely to be selling into strength again.
Daily Chart:
 Price has so far rejected the 76.4% retracement line of the move up from the 8902 low and the top of the daily volatility channel, but in a subdued fashion. It does look corrective so far with the daily MyWave still bullish. The stochastics have let off a bit of steam this week and the trend bands in the same chart are even setting up for a bullish cross, with a bullish RSi study, if any upside is seen. However, if another move up into the 9800-9900s is seen, the stochs will still be overbought and I'll be looking at the monthly/weekly set ups for selling into strength. For now, I am looking at the daily Ichimoku Cloud and daily 200sma to provide support at around 9500/9550 to buy again, subject to the lower time frames cycling in the correct fashion.
4hr chart:
 The 4hr chart has been building a downward channel off the 9782 high but with those stochs starting to look oversold and the trend bands in the same sub chart still bullish (white over orange), the price action here does seem to be supporting suggestion of a move up in due course. The lower channel perimeter of the upward regression channel and the 4hr Ichimoku cloud has not been hit yet and MyWave is red for bearish, so I will start the week off looking for more strength to sell but then buying weakness into those zones into the 200sma. This all depends on the hourly cycle playing ball and with the REFM model at the top of this post calling for a bullish open, I'll be as flexible as the market action requires me to be.
The model forecasted the Dax's behaviour last week pretty well, suggesting that I look for strength to sell. As I mentioned yesterday, forecasts of rises in high-energy (relativistic) electrons over the weekend had me looking to close shorts early and indeed, Monday's forecast looks bullish for the Dax. If the market does not gap up, or even better shows weakness from the open, I will probably be looking for opportunities to buy.
So what does the Technical Analysis look like?
Monthly Chart:
Weekly Chart:
Following a retracement of the 23.8% line from the wave 2 low to the wave 3 high, price has made it back to the pink dashed resistance line and the gold dotted median line of the volatility channel. Price had also bounced out of the weekly Ichimoku cloud and the linear regression channel perimeter. However, the RSi on the weekly chart is still negative and MyWave in the main chart is still red for bearish. The stochastics in the first sub-chart have followed the rejection from the 23.8% zone, but the trend bands in the same sub-chart have just turned down, despite the pull back. The weekly chart seems to be rolling over and fits with the 'b' wave of wave 4 or A of 4 from the monthly chart. However, this is big picture storyboarding and of little use to me intraday, although the higher price action pushes into the pink dashed line, the more concerned I would be with taking bullish positions, and more likely to be selling into strength again.
Daily Chart:
4hr chart:
Friday, 12 September 2014
#dax $dax
Don't like the price action on the 5mins - already oversold - could just be a 'b' wave within the triangle on the 15min. Friday; 2 good trades banked today. Not being greedy. Calling it a day. Catch up Monday.

Subscribe to:
Posts (Atom)