Tuesday, 24 December 2013
EURUSD: price at monthly FLD
EURUSD: moving slowy
But the proposed contracting diagonal formation still looks a fair option to follow. I am keeping an eye on that planet conjunction ahead for the New Year and with time running out until then, the diagonal does seem a neat way to put in a 'B' before the ride up into the 1.4000s. Looking for 1.3570-50 for 'iii' to push the 50% retracement zone of 1.3831 to 1.3294, before a move up to 'iv'.

Monday, 23 December 2013

EURUSD

EURUSD


EURUSD: targeting 1.3550 for 'B' down complete.
It looks too late in the day for price not to be looking to create that momentum nest on the 4hr chart. This tends to coincide with a confluence on the daily bollinger (20x2.25) which on this possible drive down may be at the 50% retracement of the move up from 1.3294. Given the positioning of the regression channel down from 1.3810, an ongoing diagonal is likely, although it still looks like it needs more filling out before further falls. Price is riding the underside of the regression channel up from 1.3294 and whilst that holds, I am expecting a push down to the 262x of Friday's drop at 1.3577 currently, although again, we may get a bounce for a wider correction at the 162x at 1.3622. Expect anything I guess but I want the deeper target to move shorts off the page and take ride up again into 'c' of 'E' of big 'C'.


Friday, 20 December 2013
EURUSD

EURUSD
Busy with christmas commitments but a quick one. Looks like an 'abc' today. Will look out for 'b' down and then 'c' up, quite possibly in an expanding diagonal. Not quite what I was looking for but will take it, if it comes.

EURUSD
Pull back to diagonal perimeter is usual price action but has to hold if a move past the daily pivot is to catch. Yesterday's low is in the same place, too.The MMA wave on the 6 pip range bar study is trying to turn but some consolidation to let VWAP catch its breath is key, and to calm any immediate thoughts of turning my diagonal into a 'b' wave of a running flat in the downward correction, instead of ending it, as in my thesis.

EURUSD: 'B' wave or 'a of b'?
Simple chart to state my case.
 First things first; that regression channel and trend cloud (SMA 60 plus FLD of same) on the 240min chart is not very bearish as yet, albeit the latter is of course under stress. The price drop was to just above the 38.2% retracement of the whole move from 1.3294 and has so far stayed above the consolidation zone to the left. Although the momentum cluster has not nested as yet, it is oversold on the 4hr and 8hr studies which has me thinking that if this move is not a trend change to the downside and is in fact either a wave 4 or B wave of the whole structure, might this move just be the 'a' wave of that pattern? Also, looking at the size of the move in time, it is already disproportionate to the prior pull backs and in fact if it is an expanding flat, is a fractal of the first correction of significance after the 1.3294 low. As such, I prefer this to be either 'B' or 'a of B', which brings into frame that 100% extension above and higher, but also the distinct possibility of a direct strike into the existing high in 'b' of 'B' followed by 'c of C' back down here, again creating marginal highs and lows, before making the next main move up. If I see price go for broke into the 1.3810 area again, I'll cover my longs and see what happens. If it does start going down again in 'c' of 'B', I'll add to the shorts.
EURUSD: Spike out of diagonal
Should get a reaction now and some clarity as to whether a correction has ended or a new trend begun.

Thursday, 19 December 2013
EURUSD: diagonal
If this does not break out, we could be in for a bit more grinding downhill. Pretty obvious statement I know but keeping my eye on the pattern.

EURUSD: the bears are out but not here
 A few more pips and I think we will get to see what is really going on. There is a lot of bearish analysis on twitter, but that looks like a decent momentum nest to me on the 24 pip range bar study. Also, worth looking at the MMA wave formation of the bullish wave leading up to this assumed correction and compare it to the drop. It is either not complete and has more to go to make it look more impulsive, or it will shrivel up and die as a 'c' wave in a flat, that I have been counting. If price gets to the daily pivot today, I'd be betting on more up rather than a reversal but we shall see, as we always do. A few more pips.......
.png)


Wednesday, 18 December 2013
EURUSD: shorts let go


EURUSD
All a bit frantic, but I think my count was right. Too quick for me to do anything about that, so looking for 5th wave up in a more orderly fashion to reach 1.3890 area. Not too worried about doing too much until matters settle down though.

EURUSD
The alternative pattern discussed already is the triangle. Here is the 4hr trend cloud with a daily Bolly (20x2.25/2.5) overlay. The target zone for a last kiss goodbye would be 1.3890, which is also the next 22.5degree step up on the square root progression chart. A thrust out of the triangle to 1.3890 in 5 waves with an ending diagonal at the end. Could it happen? Could be. Just trying to be ready.


EURUSD
Could be a triangle as discussed earlier but I am looking for other explanations. The move this morning has me flat again, looking to lose longs higher up and then a proper decline. This count suggests we may get 'c' of 'B' up on FOMC and then the decline. The rise into that 1.3809-1.3831 zone would work perfect as an expanded flat, dividing the two prices and pushing nerves out a bit more. Anything persistent will confirm the triangle but I am looking for up then down.

EURUSD
Not a lot changed from yesterday really: is it a triangle or not? If it is, it will go up, if not it will likely go down, but with FOMC today, most definitely volatile, regardless, me thinks.
 The square root progression chart from 1.2041 saw price bounce up from the lower red diagonal in the cluster, having broken up through a blue diagonal on Monday: so it looked like a retracement. However, price then hit the red diagonal above but not with a higher high and has been peeling away over night and this morning, underneath the median of the regression channel. That 1.3743 horizontal is key again (being almost at the weekly pivot position too). The main issue for the bulls is that the momentum nest looks like it might be on and with the planet conjunctions coming up, it may just be that we see the lows into the New Year rather than a new high.
 So, as I said yesterday, it is all about the triangle storyboard right now. The 4hr trend is bullish (or more accurately, has been) but the flat weekly FLD cloud above confirms the corrective nature of this price action, right under the 1.3831 high. Assuming that high and the 1.3294 low holds, the storyboard is likely to morph into the correction of the whole move up with the usual fibo suspects; the 38.2% stands at 1.3611, but it will be interesting to see how the 23.8% copes at 1.3685 first.....if we get there!
Tuesday, 17 December 2013
EURUSD
It is starting to look like a triangle, but the next leg down might having something else in store. Price action is not getting high or low enough to bank anything unless contracts are bought at the extremes, so it is certainly doing what a triangle does, but I'd still prefer a good run downhill. We shall see if price can hold that daily pivot, and I have added another count worth keeping an eye on.


EURUSD


EURUSD
Looks like an expanding diagonal to conclude the 'c' of b' from last post. Break above daily pivot should get this moving back up again to test tops.
EURUSD
That reaction up is looking strong. Need to be careful around that 1.3810 and 1.3831 zone. If it powers through, then the correction is already over! I managed to edge long on that drop, but would much prefer to get another chance of losing the shorts near 1.3710 before it goes up. As long as it goes somewhere though!

EURUSD

EURUSD
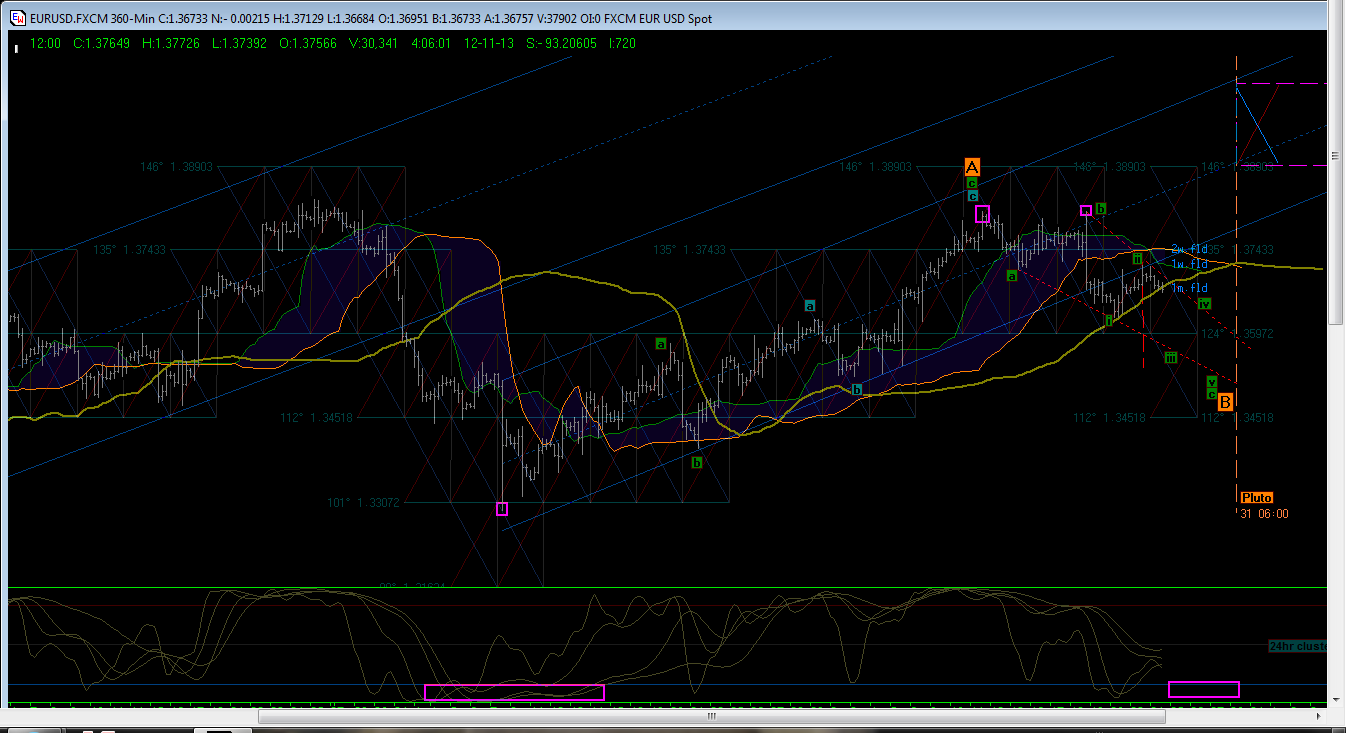
Been tidying up the charts. Here is an overview.
 The 1wk/2wk FLD trend is bullish but flat in an assumed minor correction. The pink box in the sub chart was the last time we had a momentum nest/low and one is due on the near term horizon of a larger degree than this one appears to be, unless this morphs into that one. The conjunctions of Pluto & Venus with Earth & Sun are due in the New Year and may make for a target top prior to that larger low coming along. Alternatively, it could be the target low but I don't think so given the way in which the 45 degree angles on the square root progression chart keep flowing uphill.
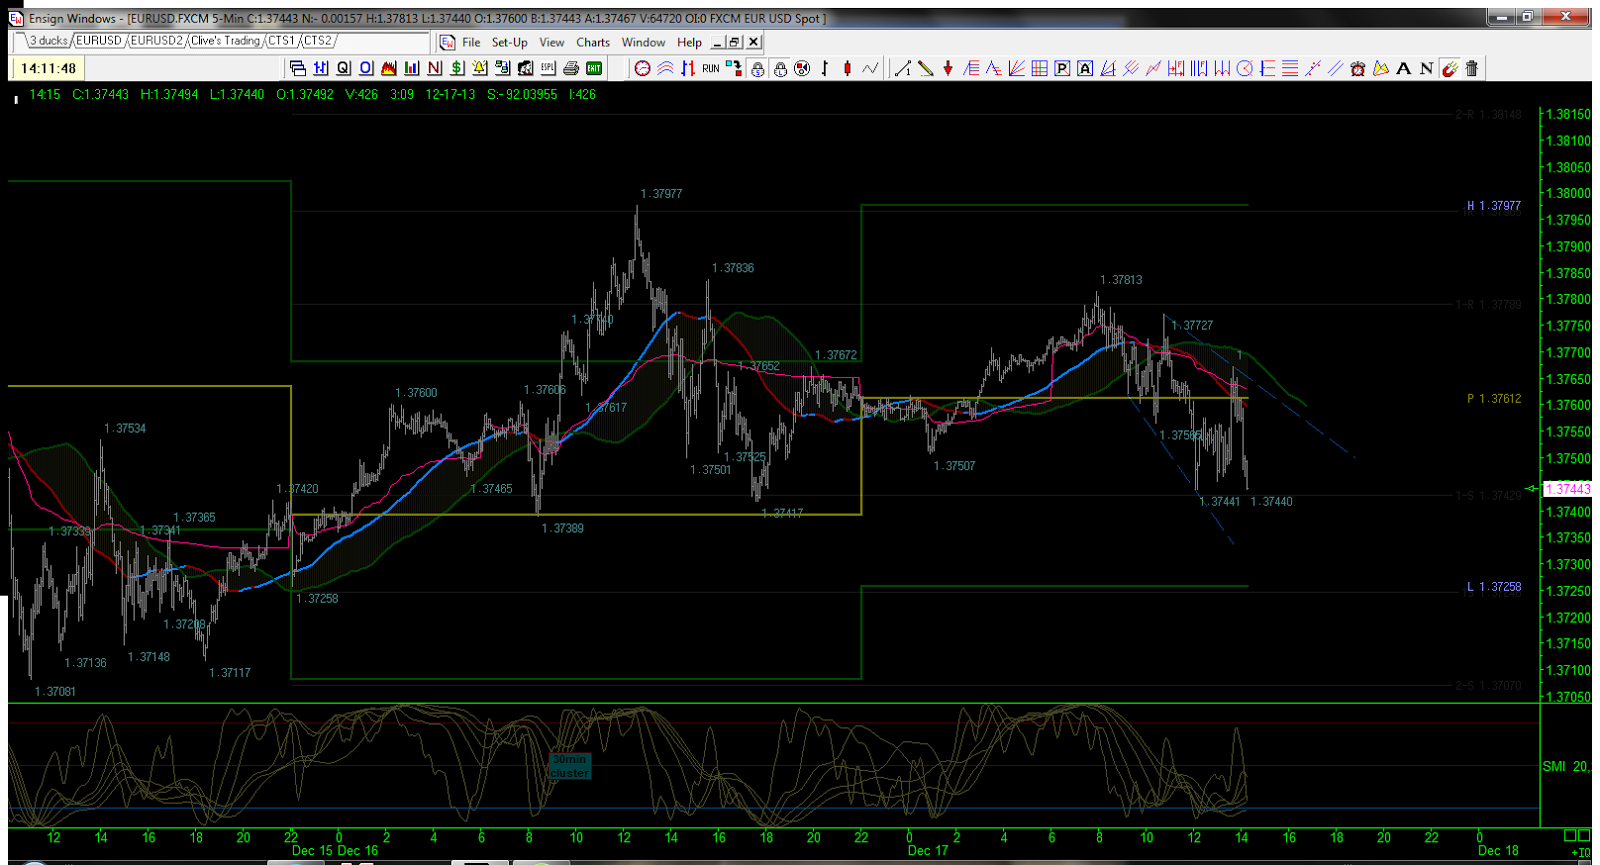
 The 4hr trend (combined SMA & its FLD to form cloud) is bullish and appears to be forming a minor correction within that trend. The momentum study suggests there is more upside to come which fits with the minor/major correction desicussed above. However, it is touch and go as the momentum nesting at this degree (pink box) is due too. One more move up may be enough to move into the bigger decline.
 On the 60 min chart, the correction looks incomplete although I think that there is an expanded flat already in place but a triangle would keep this going a bit longer of course, but also give us the nod that there would be that final thrust. Whilst the 4hr cloud stays in tact, I am trying to lose shorts lower down but attempts to do that without the longs tagging along has failed dismally so far and may have to come for the ride.
EURUSd
Only just noticed it: blame it on the head cold. Could this be an expanding diagonal in a 5th wave up? Don't know, but we will in due course. Looks tidy enough and all in 3 waves thus far......

EURUSD
 Whether it is the holiday season low volume or ongoing correction, it is tough work this. The price action continues to grind up hill, taking out a blue diagonal overnight (green arrow) and putting another red support line underneath. The FLD cloud has gone flat, so it looks and feels like a correction, but is no easier to trade in the knowledge.
 I had counted the correction into the 1.3708 low as an expanding flat, due to the the larger 'a' wave going into the 1.38096 top from the previous waves. However, although the move up from there also seems to be corrective in 3 waves, the drop thus far does not seem to have been impulsive to usher in a 'C'. So either the 'B' wave is still in play, 'C' is beginning with a lacklustre 'a-b' although I don't like that explanation, maybe this is somehow turning into a larger triangle or the correction is over and it is just a slow grind up till the 1.3831 area is retested. Struggling I am! The 6 pip MMA wave is still bullish and price does not want to play underneath the daily pivot much at all, so any action is likely to take place from yesterday's highs, if it is to come. Any attempts to lose my longs in favour of shorts continue to fail, leaving me flat again as price keeps pushing into my cautious stops, so for now, going nowhere very slowly! Probably going to need Claims and FOMC to sort this out tomorrow.
Monday, 16 December 2013
EURUSD

EURUSD
Square root progression grid on the 6hr time frame saw a rejection of the blue diagonal today - marked with green arrow and thick blue line. If the high holds, the next two diagonals below provide support zones with targets at 1.3691 and below that at 1.3630. If Friday's low at 1.3708 folds, then will look for these in succession.

EURUSD: wave B OR Wave 2?
The size of this assumed retracement uphill, makes this a likely B or 2 for me. Looking for sharp move downhill and have marked out the fibos for the move from 1.3294 as targets. A '162%' extension of the current 'a' wave down, would reach 1.3611, which is the 38.2% mark on the chart. Fingers crossed for my shorts as have let the longs go at 1.3772 for now.

Saturday, 14 December 2013
EURUSD: Elliott Wave count
If the first leg up is complete from 1.3294, then I think this count is as good as I am going to get. As ever, unravelling price action will determine what degree the move down will be, but it is possible that the current retracement is in leg 'c' of 'a' down. I have already posted on short term targets for that earlier today.
.png)
EURUSD: weekend review

48 pip range bar study: Trend remains bullish.


6 pip range bar study: at this degree, the trend is still bearish and choppy to say the least. But with price pushing the previous days lows and failing to make a mark uphill, indeed, drifting away from the daily pivot, it appears there may be more downside to come, as per the remarks above.


Friday, 13 December 2013
EURUSD: knocking on the exit door
Much better day today with the ongoing thesis. Price now at the UTL of the regression channel of the corrective move, assumed to have concluded at 1.3708. A breach here and hold above the daily pivot would add a little more weight to the argument that the downward move is over. The momentum study here suggests there is plenty of support for a thrust up, so let us see if she comes.

Subscribe to:
Posts (Atom)