
Monday, 30 June 2014
#Crude Oil

4hr chart shows price holding up at the green median line. With the bolly tops at $110, I am chancing longs from 105.19, with stops already at BEven, as failure would like see a spike down.

Sunday, 29 June 2014
#Crude Oil $Crude Oil #trading


#US$ $US$ #Eurusd $eurusd #Trading

The US$ is approaching the 50% retracement point of it's prior rise and with positive divergence appearing on the hourly chart shown, I am looking for some $ strength.


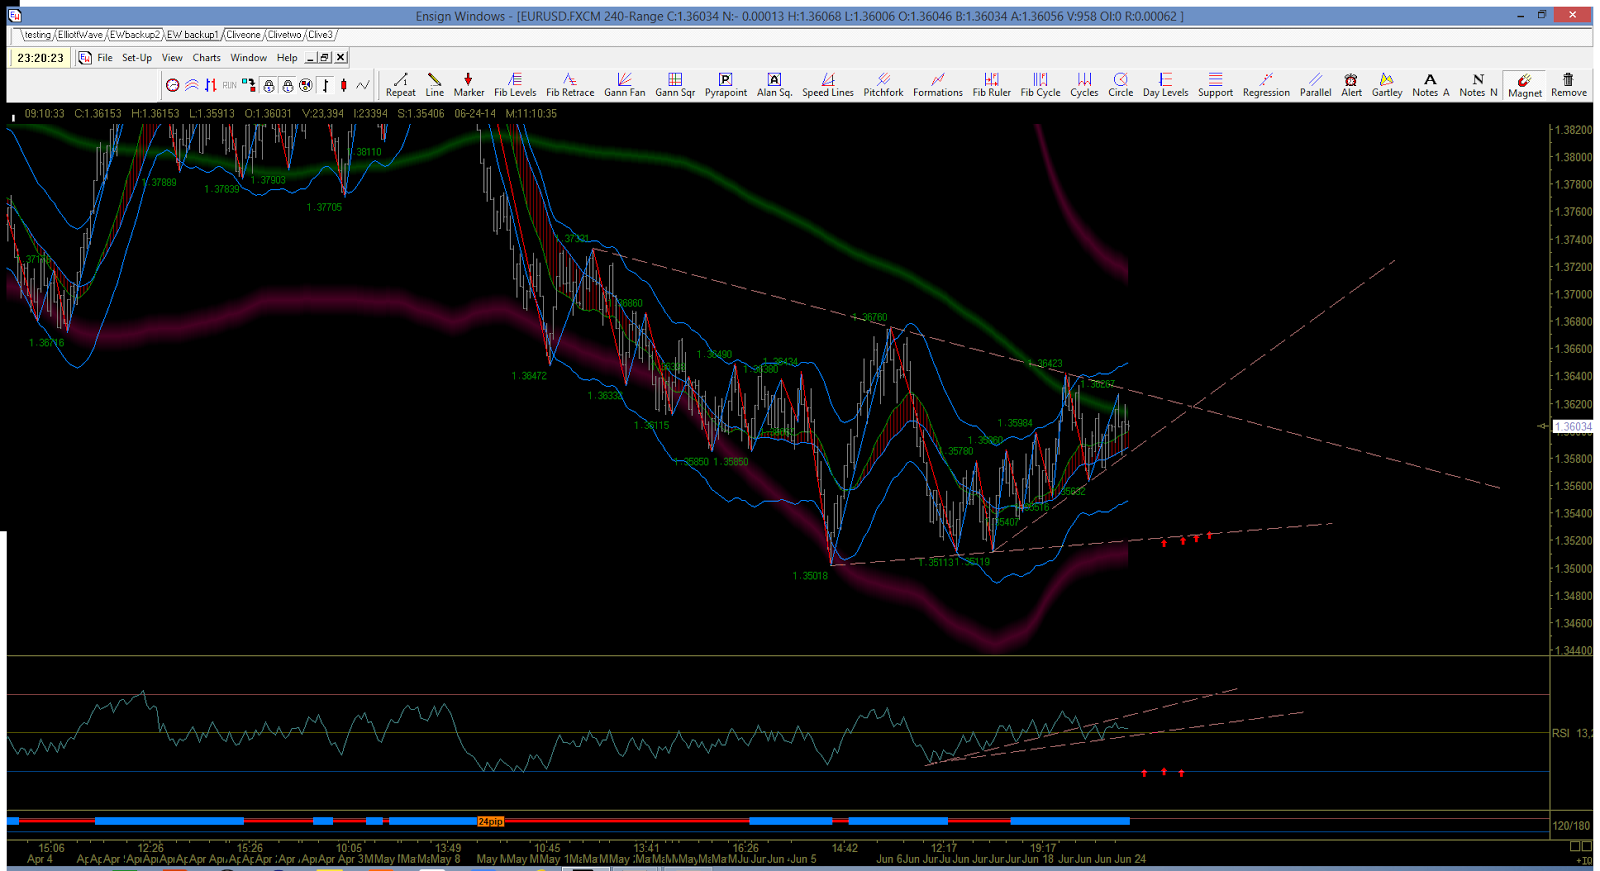
Both the 24 pip and 12 pip range bar studies on EURUSD were showing negative divergence going into Friday's close and given the painfully slow upside, I had closed my longs in the 1.3630 zone in the early afternoon. With the bollys and respective price envelopes being pushed, the pending $ strength may bring an opportunity to look short again or at the very least, buy lower. Either way, I am not interested in looking northbound before a reset.
Friday, 27 June 2014
#Eurusd $eurusd #Trading
I have banked longs and calling that a day for EURUSD. Might just carry on up from here, but I don't like the look of the 'rsi' and price action and keep expecting another test lower. Been a good day and still have a US Oil trade running, so I'll manage that for the afternoon. Catch up next week.

#Eurusd $eurusd #Trading
Pivot & Daily Open seem to be holding. I am entering long with hard stops at 1.3605. Might be tight, but it is a Friday! If it holds, last night's count could be on for a drag to 1.3700 zone.


#US OIL $USOIL #Trading
The 24pip range bar study in US OIL is looking at the cliff edge here for a run lower. So far price has not tried to escape higher, so perhaps there is a nice reward here.

#Eurusd $eurusd #Trading
I have closed shorts there at the daily pivot and will see if it holds or not.

#Eurusd $eurusd #Trading
The chart posted contains rolling Raff regression channels for 1-4 weeks. The legends are manually applied, so that I have to move them each morning back to the channel perimeters. In this way, I can see whether the channels are moving up or down. All of them moved up this morning, including the monthly. I have banked my longs and attempted shorts (cover above 1.3662) on the basis that the 'rsi' suggests that a final flurry down to tag the 3 and/or 4 week channels (blue & orange) or as close as price wants to go. The general idea is that the monthly trend traders will be wanting to buy nearer there than up here. They may not get their fill but I am trying the drop down for a bit anyways. Somewhere lower to buy would be great.

Thursday, 26 June 2014
#Eurusd $eurusd #Trading
I am counting that move down today as complete for an irregular flat, but there may be a deeper move into the weekend. Bottom line is that a 'c' of 'C' up should be around the corner, whether from here or into the 1.3560, but we were close enough this afternoon already. Given all of the choppy price action, I am hoping the final leg is more of a rocket ship, but I very rarely get what I want!!

#Eurusd $eurusd #Trading
Not accelerating away below yesterday's low here - come a long way this morning - have banked shorts and laid long entries above the last lower high there at 1.3612, in case of a spiker. Near bottom of the weekly regression channel (pink) which was yesterday's target, so let's see where it takes me. No trades on at the moment until those longs are taken.

#Eurusd $eurusd #Trading

Wednesday, 25 June 2014
#Eurusd $eurusd #Trading
My cover got taken above 1.3630 on that move up, but I have banked the longs and price is roughly back down to where that kicked in; cover now above where I banked at 1.3655. Here is the 24 bar range chart again: I have found that drawing trend lines between adjoining 'humps' made up of the price envelope provides interesting projections over and above the price turns themselves; I assume because the PE includes extremes of the usual range. Anyhow, I want to buy when the RSi is nearer 25 and not up here. The upper trend line is being peppered and the bollingers have some life in them granted. But if the upper trend line fails here, maybe we have a diagonal in play. Don't know till we get that target RSi reading, but I am not chasing up here. So, trying to stay short whilst that cover remains in place.

#Eurusd $eurusd #Trading
Trying shorts this morning, with cover above 1.3630. Looks like a 'b' wave stab yesterday back up, so keeping with the retracement theme back to test the 1.3501-1.3546 zone, as per last night's post. That is where I would like to buy, assuming a turn up occurs, so I am hoping the market agrees and gives me both side of this next 50 plus pips. Of note is the weekly regression channel (pink), which has started flattening off now, given the lack of upside progression - I'll target the bottom perimeter for my shorts, looking for an ending pattern near there.

Tuesday, 24 June 2014
#Eurusd $eurusd #Trading
It has been an eventful day! Closed out for the night, as seems to be little edge in remaining long here, just hoping for follow through. I am posting the 24pip range bar study, which at least highlights how a combined 'rsi' touch into oversold conditions, combined with a retest of 1.3501-1.3546, would provide a price envelope and bolly band bounce opportunity. It is probably asking too much, but sitting here waiting to get shot tonight, does not seem wise either! Catch up tomorrow.
#Eurusd $eurusd #Trading
 Nice ride down - nothing broken however in uptrend thus far, so banking there and tempting longs again with cover under 1.3560.
 Have a look at the rsi in this weekly chart from the 1.1890 low in 2010 - if it holds, could support the big bounce theory!

#Eurusd $eurusd #Trading
This current leg up has almost reached 127% extension of the internal 'abc' count as shown. It could be a triangle building; it could be the 'a-b' down completing from 1.3642; or something else. However, the move looks laboured and fits into a retracement storyboard thus far, better than a trend change; the 'rsi' seems to concur. I have banked longs and moved short, with cover above that 1.3642 high.

#Eurusd $eurusd #Trading
So far, this count from the weekend is holding, and while that 4hr rsi keeps in tact, there is probably little reason to doubt this move up. However, given the price action since Friday, I expect this to fold. We shall see.

#Eurusd $eurusd #Trading
And still no resolution. The weekly MyWave trend still looks compressed and in a triangle formation. Given the move was down into that triangle, it may be that we get a retest of the lows again, but it looks like there will be more action than yesterday! I am flat here and would prefer to see a drive down to clear the air and hopefully release a decent move to the upside. Summer doldrums may be with us though!

Monday, 23 June 2014
#Eurusd $eurusd #Trading
Raff Regression can at least describe what has been happening since Friday evening, but it can not make this market move any quicker! The red channel is the rolling weekly hi & low prices wrapped around the regression mean. It is sliding up hill and projects a target near 1.3680, which fits with my expectations from the weekend report. The green channel is anchored at the beginning from the last high there to Friday's low. As such, the green channel is locked into place until a new low is created, and time is pushing the price action into the perimeter. So far, this little battle between bulls and bears is pretty equal. A break either way, should get the momentum going again.

Saturday, 21 June 2014
#Eurusd $eurusd #Trading #elliott wave #USD
Been a tough week and looking back at last weekend's review, I seem to have got caught up in the minutiae when my original analysis seems to have held so far. In fact, I will be as bold as to say I got greedy trying for a new low and got smacked hard for it. Anyhow, the sun is shining and I am going to simply lay out the charts as I see matters and try and trade next week on the long side only. I think the charts will explain why. The last two charts are for the US$, just in case you miss it.


Friday, 20 June 2014
#Eurusd $eurusd #Trading #elliott wave
It looks too pretty not to be given an airing. Same upside targets but maybe the correct description of what has been happening.

#Eurusd $eurusd #Trading #elliott wave
If the diagonal holds, price should either be in wave iv still or already in wave v - a poke out of the top trend line is the usual flame out, to watch for a reversal. The resultant drop out of this will either be a retracement or the next leg down. I do not mind which it will be, but intend to be short into it.

Thursday, 19 June 2014
#Eurusd $eurusd #Trading #elliott wave
Well, if it is not going to go down, perhaps a larger flat is in the offing. I have covered my shorts and will look for the 50-61.8% of the drop to be reached, and also the 127%-162% extension of 'a' of the flat. Ping pong! If it just goes down as per my original plan, I'll hold on to the cover until price is in the 1.3400 zone and try my luck there instead.

Wednesday, 18 June 2014
#Eurusd $eurusd #Trading
'Fed day' today, so consolidation is normal. Overnight price action looks like a 'b' wave correction to me, giving up little of yesterday's declines, which were hard fought. I am posting yesterday's bolly chart to restate that weekly-2he cluster below, but also with the rsi study overlaid at the bottom. See that ledge: price action has got to break it to drop, hold it to not. We shall see....

Tuesday, 17 June 2014
#Eurusd $eurusd #Trading
Price action is very awkward but thankfully going my way for now. Do refer to the EW count in the link on the right of the page and the past few posts, to recollect the plan. I am selling into a low, to then reverse long, that should produce an excellent reward when it comes. Here is another picture of why 1.3440 zone is key- cluster of weekly, daily, 8hr & 2hr bollys all likely to be at the same place at the same time. See you there!

Monday, 16 June 2014
#Eurusd $eurusd #Trading
Beautiful MyWave on a 3 month setting. Please refer to EW count on right of page for proposed 'b' wave ending somewhere around here and a drop into the 1.3440 zone. The lack of upward thrust would suggest the Wave remains in tact and that further drops are to be expected, given the momentum study position.

#Eurusd $eurusd #Trading
If not this time around, it should be soon. Looking southbound to 1.3440 zone or lower.

#Eurusd $eurusd #Trading #elliott wave
Does look like a head and shoulders pattern playing out with a neck to head target of 1.3440. Will see what the next drop looks like.

#Eurusd $eurusd #Trading
Weekly MyWave has already turned down and have banked longs from Friday evening for a small profit and now trying to stay short into any drop from below 1.3551.

Sunday, 15 June 2014
#Eurusd $eurusd #Trading #elliott wave
There was a error in my Price Range Channels in last night's posts. These have now been corrected and the charts updated in that post. The main culprit was the 'yearly' channel on the 288min chart, which showed the rolling yearly low's being pushed, but in fact, it was the 50% zone. Anyhow, please do check back to yesterday's post to readdress.
Saturday, 14 June 2014
#Eurusd $eurusd #Trading #elliott wave
I have been recalibrating my momentum studies and representations of trend cycles to provide an overview of the rolling Elliott Wave count as I see it. I definitely do, so readers should unequivocally accept as well, that this is my interpretation of matters. As such, the '1+2=3' syndrome represents my biases: are the MyWaves and momentum cycles actually representing the Elliott Waves, or am I retro fitting. I don't know, but this is a circular argument!!
 Leaving that aside, I am unquestionably bullish on the next big step for EURUSD and that is up. However, I'll only get to look back at that in the future and I don't trade big waves anyhow, as readers will know; I am quite happy to trade all waves intraday. So here is my big count on the daily chart, incorporating a 5 year trending MyWave, with each band accounting for a year (with the first year being the thin red line). That is a big cycle retracement going on with price now pushing the 5 year MA band, but the Elliott Wave count continues to argue that we are in the final throws of a 'c of B' down. Now, on a 5 year trend, one would expect any turn to be spikey, so I have been setting myself up to drive down into that low and then reverse for the launch towards 1.4416, where big orange A-B gets to 100% extension at C. Note also that we are bouncing around the 50% retracement band of the rolling 5 year hi/lo channel, with momentum in the oversold zone. At least worth attempting to catch a ride up, me thinks, even if it fails in due course.
 Following on to the smaller 288minute bar chart, MyWave now represents the yearly trend (the gold outside MA, accounts for 240days of rolling price action, with each band stepping down in 2 month gaps). No guessing that the trend has been down since the May high, and I have matched the momentum cycles to the EW counts, the best I can - it has been very messy of late, which I am taking to back up my conclusion that the market is setting itself up for a big launch up, having convinced everyone it is going down. Price has been pushing the rolling yearly 50% of the range channel, which is not a bad place to be looking for moves back up hill, but my count here suggests we may get to 1.3600 ish Monday/Tuesday and then drive down towards 1.3430-1.3310 - quite a range that, depending on which A-B equivalency we go for, and I'll be out of shorts early for sure to start buying into a turn, so the lower the better for me.
Friday, 13 June 2014
#Eurusd $eurusd #Trading #elliott wave
Well, now its the last post! Channel broke, so I got within 5 pips of that bottom. Got a long on, already at BE, with a target of 1.3590-1.3600 for Monday. Catch up then.

#Eurusd $eurusd #Trading #elliott wave
That's me out for the night - closed all trades and will relook Monday. Might miss a quick drop, but would like to see a retrace of some sort, of course, or maybe I get lucky and this is a 'b' wave down, so I get a 2nd bite of the cherry next week.
Thanks for reading.

Thanks for reading.
#USD $USD #Trading
The US$ just pushed on past the 61.8% of yesterday's drop and does seem to be forming a contracting diagonal for a grind higher into the annual pivot at 81.30, where I have the weekly bollys too (not shown). This 4hr ichimoku cloud does not look under much pressure to me and in fact appears to have rebounded positively so far, which looks to have helped my EURUSD shorts today.

#Eurusd $eurusd #Trading #elliott wave
I have been pondering whether this is just a 'b' wave down and another thrust up to complete 'B' is coming, but I just don't know. For now, there is nothing bullish about this drop, so I am hoping for continued movement and the 1.3501 low to fold. We are certainly getting close to the various lows; if one would go, maybe....We shall see....

#Eurusd $eurusd #Trading #elliott wave
Momentum study looking very poised on the weekly chart.....if this goes, the drive down we have just seen, may get very lumpy indeed.

#Eurusd $eurusd #Trading #elliott wave
Looking good so far.....

Cover across the top, in case this is some fake spike only to rip my face off to the upside! But otherwise 1.3454 would be great..
Subscribe to:
Posts (Atom)