Disclaimer

Disclaimer: This blog should be read as a 'whiteboard' of my daily thoughts and ramblings and specifically not, in any way, advice to trade. My interpretation of the works of Gann, Goodman, Fibonacci, Elliott, Hurst et al; is entirely my own and should be read as such. Any opinions, news, research, analyses, prices, or other information contained in this report are provided as general market commentary, and does not constitute investment advice. I will not accept liability for any loss or damage, including without limitation to, any loss of profit, which may arise directly or indirectly from use of or reliance on such information.

Thursday 31 January 2013

USDCHF: 10.46am

I have added D7 to the Monthly My-Wave chart in an attempt to pull together this storyboard that has been beating me up a bit mentally. Crashing through D6 yesterday does give the impression of a down trend but D7 (next sequential target after D6) is in a peaking formation above (bottoming price action). The scare-em-a-go-go yesterday would be a perfect 'b' formation activity in my opinion and a break back through D6 would help the story no-end.
However, keeping me company is the fact that D5 (also sequentially acceptable) is also above at D1/D4 confluence and a break there and a re-break of D6 to the upside would have done all the back-testing needed for a run to D7. I know I have been harping on for a week or so about this, but that low last night may prove to be a great entry, if it holds.

USDCHF:9.38am

Well, opting to wait on USDCHF proved a good call. The monthly My-Waves look a complete mess mind you with no real formation - swing city! With the lows to the left still in place, I am going with a 'b' wave count down and now a return to D6. There is little risk playing bounces off the low, so will look for something to bite uphill. Seem to have been waiting for this to happen for a couple of weeks mind you. Maybe I should be thinking the trend is down, but for me those waves look far from convincing.

Wednesday 30 January 2013

AUDUSD: 8.45pm

Price back at D1. Looking to buy as long as it holds.

USDCAD :8.38pm

D2 looks like it is falling. Looking to buy at the D3/D4/D5/D6 confluence.

GBPUSD:8.31pm

D2 looks beat but that was a lot of effort for a low order 'D' line. Have taken longs off and will wait to see what the next SMI cycle lower looks like.

EURUSD:8.29pm

Have taken a short on break of diagonal - all My-Waves from 1hr to 1month look exactly the same - non stop up without a decent retracement. Unless we get sidewards action, D1 is 100 pips below and enough of a reward for risk taken for me here.

GBPUSD: 12.45pm

Almost at D2, but no sign of the thrust yet. The 4hr (blue) SMI flat-lined through the midsection which suggests that was a 'b' or '2'. We have had a drip uphill but nothing to suggest a 'c' or '3' has really got going yet. Still looking for D3 to bank, but of course, I'll get what I am given as usual!

USDCAD: 12.37am

Is USDCAD just about to slump trough D2? If so, target is D3.

Photograph: Icecream Trees

Already a distant memory as the wind and rain blew the snow away in just a couple of days. We got around 6 inches in the end and some great shots. Photograph: Icecream Trees.

AUDUSD: 10.46am

Taking its time retracing but getting there, as per post on Monday. Price is swimming around lost at the moment, so not ready to go long again on this. Price needs to be back at D1 or looking to break above D2 with SMI low down. Got SMI at moment in right place but price is not. More waiting!

GBPUSD: 10.18am

D1 looks to be holding. I am looking for a move to D3.
This is the 'Weekly My-Wave'. A move to D3 would mean price has cleared the Wave (turning bullish) and the Gann line 1.5908 would be a great confluence with D3. Would expect consolidation back into the wave for a bit from there.
This is the monthly My-wave with just D6 showing (monthly displaced trend cycle). Note how it is into its peak (bottoming cycle). This is why holding D1 to the upside on the first chart looks interesting as we should be able to follow the journey back up to D6.

USDCHF: 6.46am

D4 held overnight but the SMI looks tired and I'll relook when the 30min is at the bottom of the subchart.

GBPUSD:6.44am

Everything seems to be going in slow motion; GBPUSD right up against D1 and the SMI cluster looks in the right place for a breach to the upside.

Tuesday 29 January 2013

USDCHF: 8.28pm

Be glad to have this one away. Should be punchy....

USDCHF:2.49pm

D4 backtest now complete. Will it hold. All, been a bit gung ho so far this afternoon in US trading. Looking for higher highs to stick.

EURUSD: 2.46pm

Following on from earlier, suspected higher prices looks about right. Looking for ending patterns to short.

USDCHF: 12.17pm

Quick run down on why I think USDCHF is a great buy on risk vs reward.
Firstly, that is a fully mature 4hr My-Wave at the bottom of a 1hr bolly band. Higher lows and a break out of the top of that wave should be a low risk entry, even if the positioning is premature.
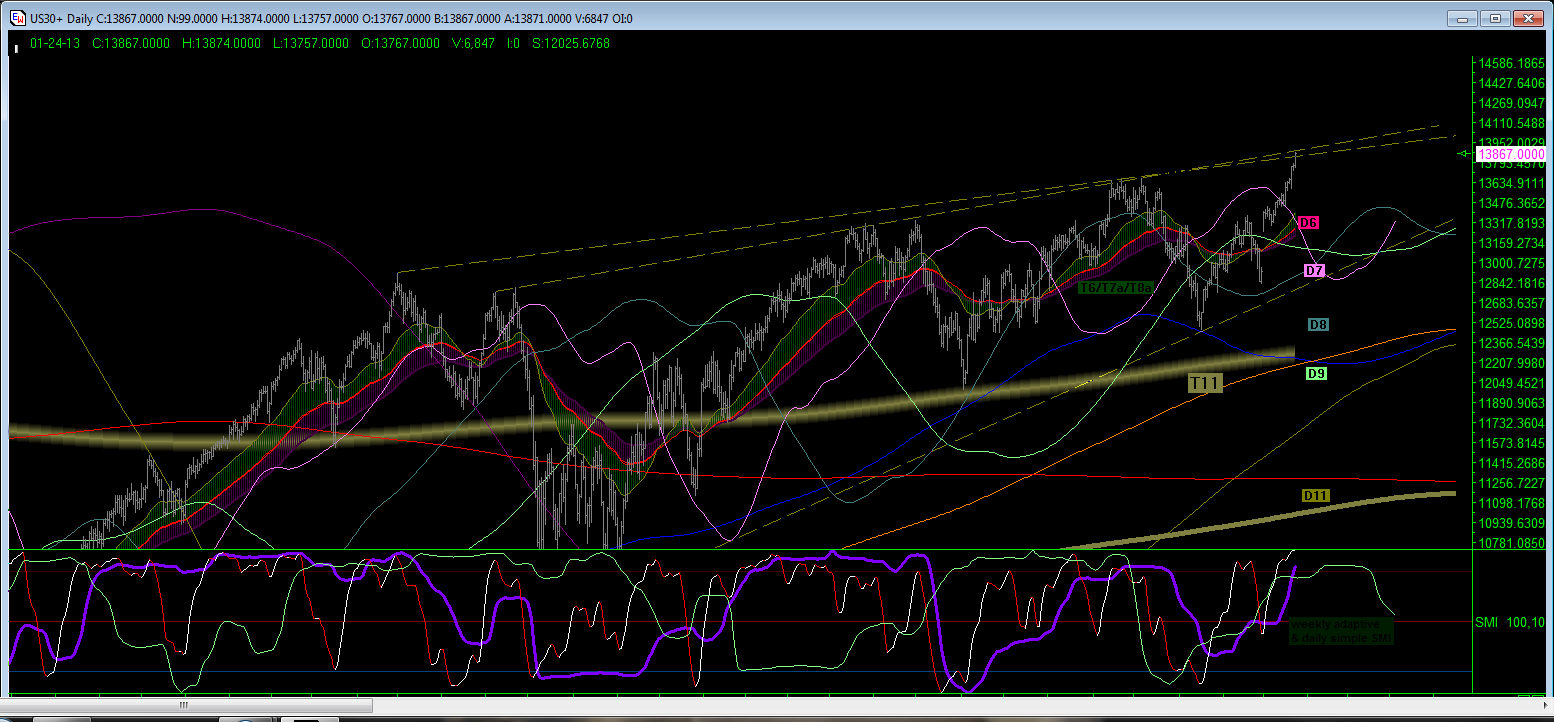
Red D4 was cut to the upside on the 14th. This whole move back can be seen as a retracement of that break as long as it holds. Price is also gunning D5 which may coincide as an upside break with D4 already backtested. Need D1 and D2 to get cut to give this a chance.
If D4 & D5 are upside breaks, where next.....D6......except we are already at D6. Where is D7 then? D7 is also in a lovely big peak which at least asks the question about a bottom being in. This is why I have been trying for a week to catch this one. Fools gold?

USDCHF: 9.47pm

I could think of worse places to be looking for longs!

USDCHF: 9.23am

Last week, my hoped for launch uphill of USDCHF turned into a 'b' wave, although I still managed to take some pips out of it. Here we are now, a week later, laying over the top of that diagonal and into D1, with D2 calling from above (D2 is in a peak which is a bottoming zone).
I am looking to go long in preparation for a burst through the displaced trend line.

EURUSD:8.19am

30min SMI cycle suggests higher prices maybe available here to short again. Might just need time to saunter over to the displaced trend indicator. In a perfect world, SMI will make it to the top of the sub chart and price will be a few pips shy of the top again before plumetting through. We shall see.

EURUSD: 6.52am

Thick purple Trend line pointing down with half cycle well underneath. Price under daily pivot. Looking for acceleration if displaced cycle (thin line)gets taken out.

AUDUSD: 6.41am

Makes target overnight. Waiting for retracement.

Monday 28 January 2013

AUDUSD: 7.57pm

Slow this, but ED perimeter has been breached. First target is the thin displaced trend line and/or 38.2% retracement of the last drop.

AUDUSD: 2pm

Looks like my cold is starting to get better and the AUDUSD seems to be getting its act together too. Just to recall from last week, the monthly displaced cycle (D1 in this chart) has been pulling price down into its 'topping' trough, having already bypassed D2 (the 2 month displaced cycle trough). If you look left, you will see that we cut blue D4 and are making our way to retest it or cut it to the upside. We have then cut D3 to the upside and now seemingly successfully backtested D1 & D2 (which sequentially follow D3 as does D4). So basically, if this move down has been the 'c' wave in an 'abc' retracement and D1 & D2 have been ticked off in the upside cut of D3, then D4 here we come and more of course, it that is subsequently taken.
I could sit here and say I have been patiently waiting, but truth is I have been too sick to bother. Having said that, I don't want to have to be too more patient now I am feeling a bit more lucid!

AUDUSD: 11.09am

Price still not made it over the Daily Pivot but we are at the 162% extension of the A&B leg of what I am hoping a completed ABC. That pivot bounce also coincided with the expanding diagonal perimeter and has created its own minature Expanding ED. However, the half-cycle trend line continues to remain above its full cycle brother, keeping me out of any selling and I continue to wait for a lift to the upside. A break of the DP and then the displaced trend line will see me add longs.

AUDUSD: 7.24am

Stripped down chart this morning as befits my addled virused brain. The thicker Trend line is flat at the moment although giving the impression of turning. Break of Daily Pivot should seal the fate back uphill, at least to the displaced average. A break of that line should see acceleration in a sustained move higher, but that test is later today, if it comes.
My-wave not got going yet, although it has turned in the right place. Will it stick?

Sunday 27 January 2013

Photograph: On top of the World Part 2

I can not believe how low these viruses take you from time to time but I am still struggling in a 'man gets it bad' sort of way. Mind just not on charts much at all and I'll have to sidestep those for today and hope I can muster some enthusiasm tomorrow. In the interim, Gracie watching out of the snowy hills in Photograph: On Top of the World Part 2.

Friday 25 January 2013

AUDUSD: 5.08pm

Not a lot for me to do today! Looks like all the hard work has been done into D7. Now back to D1,D2 or D3?

Flu got worse.

No posts today. Playing long AUDUSD as per yesterday until enough pips in bag. Back when feel better.

Thursday 24 January 2013

AUDUSD: 4.45pm

If this drop stays a three down, this could be an ending diagonal into D11. The weekly SMI only sports 2 waves so far, so a laboured grind up might work.
D1, D4 & D6 lines taken out in decline but bottoming zones for numerous D lines from here on in should drag price back up. Fits the ED from above.
Have been fading this long - looking forward to banking!

Dow: 4.41pm

Taking another nibble short here.

USDCHF: 2.59pm

Making my eyes water watching this. Missed the opportunity to bank the last spike up, so taking R1 and being grateful. Nothing but higher lows but so far any spike up is being sold down. Will look for sell at D1 rather than risk it uphill for the moment. Just AUDUSD to play with this afternoon now.

USDCHF: 10.45am

When things are sloppy choppy, I reckon it is likely a 'b' wave or 4th wave and thus although I am hanging out long for D1 at about 0.9330-40, I think that will be the 'b' wave of an ABC down completing. Here is a Pitchfork from the 'A' low at 0.9274. It seems to contain all the price action neat enough, playing the bottom perimeter for higher lows. This is why I have been able to bank little bits with this pair over and over. If we see a good 'c' wave up to bank, then there could be a good run down the other side later.
On the intra week chart, D1 would be at the 4hr bolly top and 50/61% retracement. Maybe more but that is a good target me thinks, whilst the higher lows keep kicking in.

AUDUSD: 10.09am

Looking interesting at D1 for a turn higher here.
Is that an ED on the short term chart? Buying long.

EURUSD: 9.58am

Price still at the decision point.
No decision made but it is coming. I'll let the market decide.

GBPUSD: 9.21am

Massing on the border. Short term SMI's look like they need resetting but think the break will be up. Entry above 1.5855 long for me.

USDCHF: 9.16am

It is choppy but higher lows and me in long again with lower order SMI down low. Will bank at D1 (0.9340) if get chance and wait for another reset.

USDCHF: 8.18am

Closed longs for days starter for ten. Not zooming, so taking a little and wait for the SMI to get to bottom again.

USDCHF: 7.47am

Longs picked up on breach of Diagonal from yesterday's posts. Will top up on retest of perimeter. Looking for move to D7.