The monthly chart is a little busy this weekend, but please bear with me. I want to get the big picture storyboard out of the way, so the lower time frames are easier to follow. Like any other chart, the ongoing question is 'up, down or sidewards'. First things first, the stochastics and RSi studies suggest that the move off the March 2009 low is still in tact, with neither trend line yet breached, albeit price action has been pulling back towards their respective lines. Both the RSi and MyWave are still bullish, although again under pressure. In fact, price hit the 123% extension of pink 'a-b' in making the 10048 high in pink 'c-d', in addition to the pyrapoint line 9981. It is noticeable that for all the market forecasts, price has in fact been bouncing between 9000 & 10000 since November 2013 and may of course continue until this consolidation in momentum completes. In completing the pink leg 'a-b', a linear regression channel can be extended from that price action and in this chart appears as the pink dashed line, reflecting only the lower perimeter of that channel. Note how price has been riding up the back of that into the 10048 high. Similarly, the brown 'a-b' leg has a linear regression channel lower perimeter line, that price has breached but then recovered, after the 8902 low was made. If price holds this latter line, there is an argument for a continued diagonal upstairs between these two linear regression perimeters. The closing price on Friday sits at the 100% extension of the blue 'A-B' from the March 2003 low. The 123% extension of this same 'A-B' sits at 10945, one more 90degree pyrapoint step up. A failure to hold the brown linear regression line would see a continued deterioration of MyWave and a pull back towards the Ichimoku Cloud and the green Linear Regression Channel line calculated off green 'a-b'.
However, overall, this monthly chart continues to paint a bullish picture for the Dax, with the possibility of a continued rise into 11000 seemingly forced on to the table during September. However, that particular option is being battled out in the market everyday and I am not pinning my hopes on any horse, but trying to ride the winner over the line.
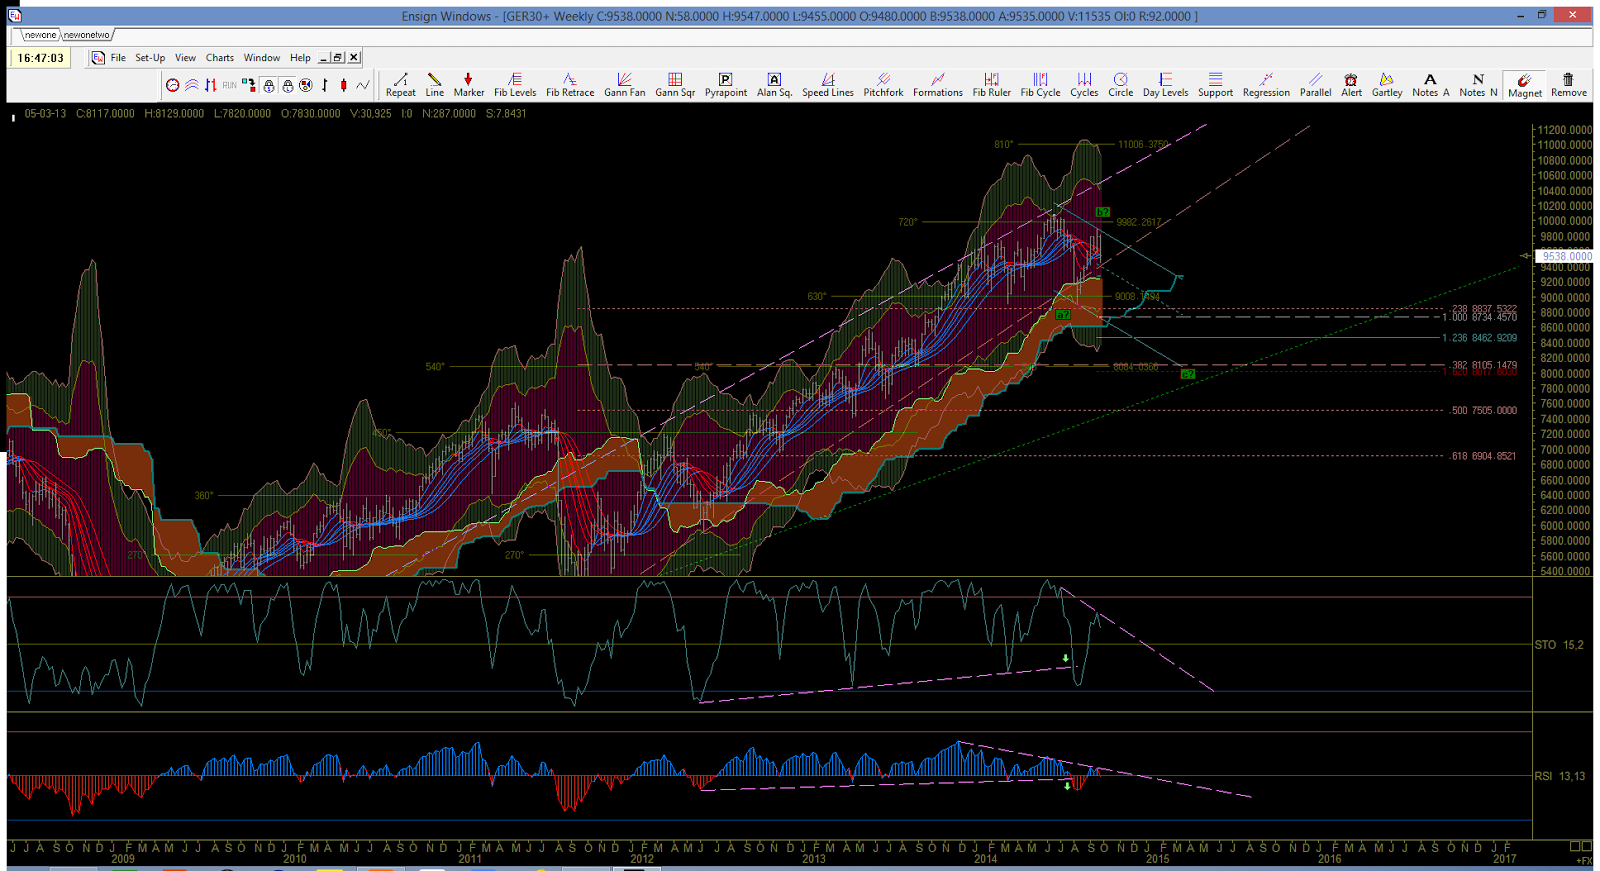
The weekly chart looks at those linear regression lines in more detail near the top. The Stochastics and RSi show a breach in trend lines in the drop to 8902, in what I am counting as green 'a'. The weekly MyWave is still holding red and both the stochs and RSi are holding downward trendlines for now. The 8902 low held the weekly Ichimoku Cloud off what also the 23.8% retracement of the 4962 Sept 2011 low. It was also the first stab into the volatility channel since that 2011 low. Notwithstanding the bounce up since 8902, whilst the bearish studies above hold on the weekly timeframe, I am running with the idea that we are in green 'b' up or it has completed. I still think the 11000 zone can be reached but by running up the underside of the brown linear regression channel, rather than recovering the pink one. If the 'b' high is in, then the 100-123% extensions sit at 8738-8467, although the green regression channel perimeter sits deeper at the 38.2% retracement off the 4962 low and the 162% extension of the green 'a-b'. So, if the brown linear regression channel is breached to the downside and holds, then the above scenario is my pathway: down then up for a new high. If it does not breach, then either 'b' is not complete or 'a' is all the correction we are getting. It would be so much easier, if I had the answers in advance!!

The daily chart however, is showing a mixed picture that suggests more wrangling over direction in the near term. MyWave is clearly red, in support of the weekly MyWave, but both are turning into the bullish blue MyWave in chart 1. Who is zooming who? For now, I am looking at that daily stoch study and thinking that the market is going to have to relook upstairs first. Generally, my first comments today, about this being a ranging market between 9000 & 10000, continue to hold and this daily chart suggests more of the same. Price is sitting at the daily Ichimoku Cloud, with the volatility channel sitting underneath that, so we will need a piercing strike through that support to move matters out of this range - look left for ground hog day! That recent price action also has me thinking that an irregular flat is playing out: that is, the 'b' leg pulled back higher than the high of the 'a' and the 'c' leg can take out the low.
The 8hr chart highlights this near term count and is supported by the oversold stochs here too. Either this is just an 'a' leg playing out to the downside, or it is the 'b' leg of the bigger green 'b' leg in the weekly chart. With those daily stochs oversold as well, I am eering on the bullish side once this pull back is complete nearer 9350 to test the 10048 high. The extent of that move should answer which side of the brown linear regression line, price action is likely to make its run for 11000. A continued diagonal would perhaps be the easier one to trade all the way up, ratcheting the tension across equity markets a while longer!
Trade well everyone.


No comments:
Post a Comment