 |
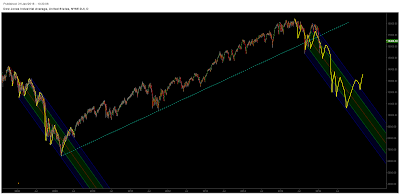
| Daily Chart - Mapping the 2008 drop and overlaying on current price action |
 |
| Monthly Chart - where it sits in long term cycles chart |
Please make sure you have read my disclaimer! This is a personal journey into self-tutoring in technical analysis. Did you read that Disclaimer yet?
Disclaimer: This blog should be read as a 'whiteboard' of my daily thoughts and ramblings and specifically not, in any way, advice to trade. My interpretation of the works of Gann, Goodman, Fibonacci, Elliott, Hurst et al; is entirely my own and should be read as such. Any opinions, news, research, analyses, prices, or other information contained in this report are provided as general market commentary, and does not constitute investment advice. I will not accept liability for any loss or damage, including without limitation to, any loss of profit, which may arise directly or indirectly from use of or reliance on such information.
No comments:
Post a Comment