Tuesday, 28 May 2013
Dow Industrials
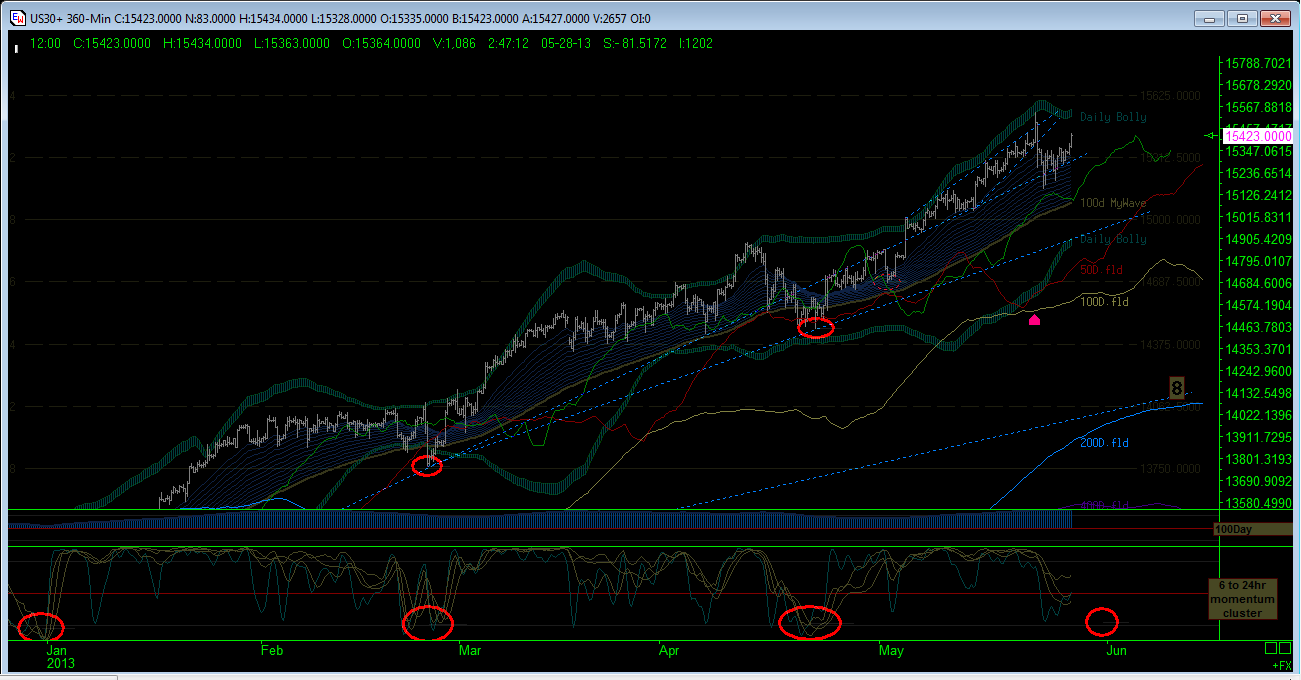
The momentum cluster in the sub panels of my charts help to define the cycles within the trends and the cycle length is defined by the legends on the MyWaves; in this way, I like to think that I have a reasonable impression of where those cycles within the trends are bottoming. On this 100day MyWave chart (and therefore 100day cycle) the momentum cluster looks about half way trough its formation. This can be either a 'B' wave or wave '2' if the downward direction is re-engaged. Because the 100 day MyWave is still completely formed uphill, it is perhaps safer to assume this overall move off the top is corrective until otherwise proven. However, it does look like a reasonable move downhill in the same proportion as the first move, will take out the 25day (green) FLD, which would bring the 50D FLD (red) into focus. As this is in the same location as the daily bollingers and the 100day FLD (gold) near the harmonic octave of 14687, me thinks that this would be a great 'tester' of what will happen next. Context if you like for the momentum cluster bottom. I think a move down here that is not a spike, would have a great chance of rolling over the 100day MyWave and then we might have a top to reckon with.
Subscribe to:
Post Comments (Atom)
No comments:
Post a Comment