Thursday, 6 December 2012
EURUSD: 11.30am
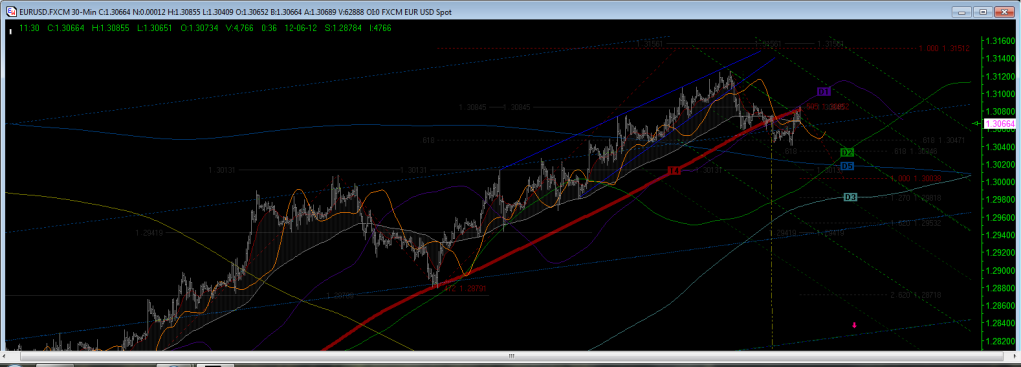
Last night when I went short, the retracement from the assumed top to bottom was 45%. I had said that this was a little light but there was potential for a drop, so I took it. I am counting an 'abc' down to 1.3044 for the 'A' wave (which is what I drew the green My-grid off) and then up to the recent high at 1.3085 as the 'B' wave as an expanded flat. Of interest is that this thrust took the retracement up to 50% of the assumed 'A' wave. If we are now in 'C' down, we have a variety of targets, but the 127% ties up neatly with D3 at 1.2981 and the 162% with the blue grid line at 1.2953. I like this latter one because it is deeper and is just above that Gann line at 1.2941. If it is a 'C' wave, it should thrust and hopefully end in an ending diagonal.
Subscribe to:
Post Comments (Atom)
No comments:
Post a Comment