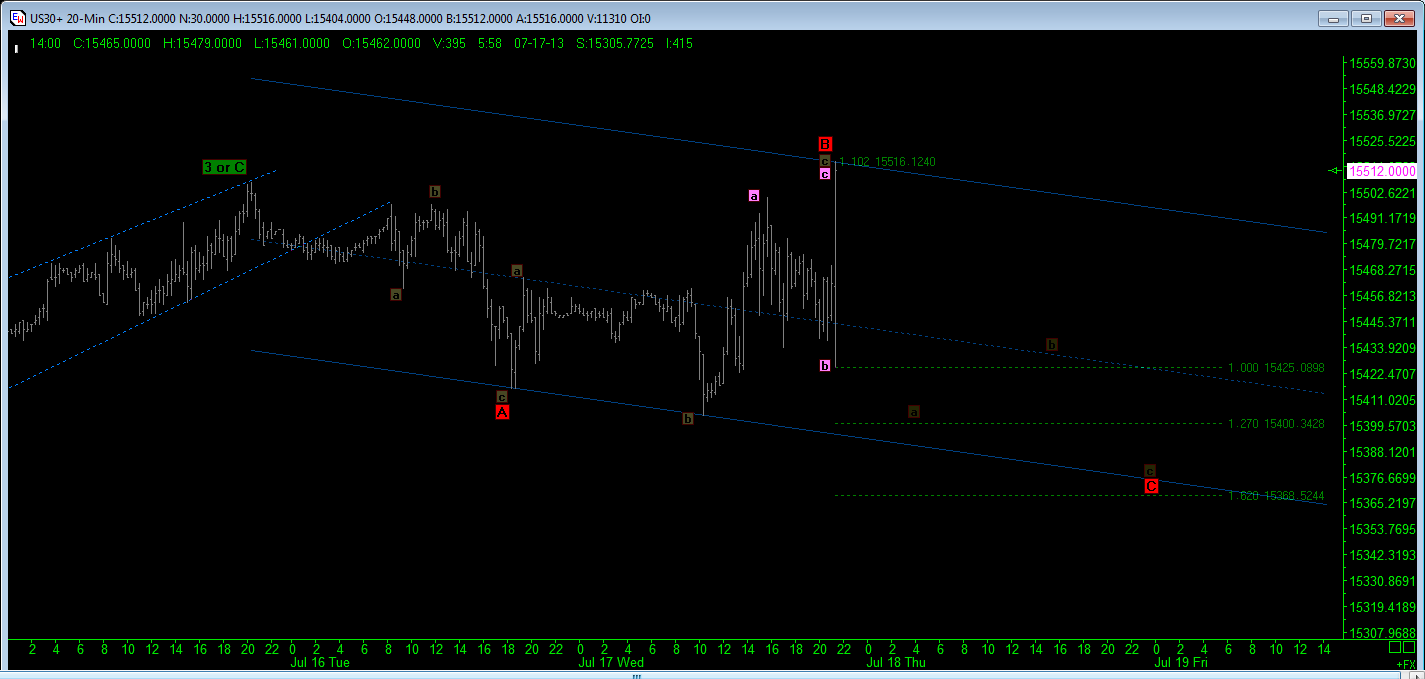
Matters seem to have progressed according to our discussion yesterday, although I am glad I switched to the Dow for a little more action! If the triangle is going to hold, then it looks like an 'abc' up for 'a of d' has played out and we should see a pull back now in 'b'. I'll track that down and see if I can't pick up the 'c' of 'd' later today.
Please make sure you have read my disclaimer! This is a personal journey into self-tutoring in technical analysis. Did you read that Disclaimer yet?
Disclaimer
Disclaimer: This blog should be read as a 'whiteboard' of my daily thoughts and ramblings and specifically not, in any way, advice to trade. My interpretation of the works of Gann, Goodman, Fibonacci, Elliott, Hurst et al; is entirely my own and should be read as such. Any opinions, news, research, analyses, prices, or other information contained in this report are provided as general market commentary, and does not constitute investment advice. I will not accept liability for any loss or damage, including without limitation to, any loss of profit, which may arise directly or indirectly from use of or reliance on such information.
Friday, 19 July 2013
Dow Jones
So what was the best trade there then? the 100 pips up yesterday or the 100 pips back down? Both of course, although I continue to favour shorts until we get the 25 day low, which seems to be some ways a way at the moment. I have banked the overnight drop given positive divergence appearing in the MFI and weakening momentum study and will see how matters lie at the New York open, hoping for a pull back to the Daily Pivot or more to short again. Overall though, yesterday's new peak does not dispel the feeling I have we are playing out an expanded flat in a 4th wave rather than the 5th.
Thursday, 18 July 2013
Dow
Whilst the EURUSD is milling around doing nothing, that diagonal on the Dow was perfectly shortable. If anyone wants to look back at the Dow Cyclic Phasing chart and see how many pips tend to be associated with moves into the 25day lows - can not always get the right drop but as long as they provide safe exits each time, definitely worth the effort to me.
Dow
Well, I can not believe it has taken me so long to unpick this top but reckon we are on verge of fall here. I count that as 5th in ending diagonal, just making a new high.
EURUSD
Trying to keep on this has been a bit messy to say the least but looks like 'b' may be completing at 'a=c' within side. Targeting 1.3250 at the 61.8% extension of red A-B.
EURUSD
Good start to the day. Have moved to breakeven with stop at 1.3100 which may be too tight, but a break up through the FLD and 60 min bolly band median line, just above price, should see the daily pivot quick enough. Fingers crossed.
Dow
Well, that is more like it. Will start looking for shorts now we are up at the bolly band. Do refer to previous posts on cyclic phasing and the awaited down turn into the 25 day low.
Dow
This is the 1min chart. The fall after last night's spike has enabled me to bank most of the shorts, albeit not with the result I wanted. But with this profile, I'll leave alone till after Claims report in the US as I need price to be at the top bollys again to re-short if appropriate.
EURUSD
Back long this morning. Pricehas made its 75day low and is not due its 100 day low till 21st August. MFI suggests volume could break up here on daily chart in support of momentum study.
Price has been playing around the gold 100 day FLD and is sat above the 75day/100day trend band. MFI appears to have taken a tumble in yesterday's falls and along with the momentum study, suggests a 'b' wave has been had. Targets for longs is the bolly cluster above and the red 50day FLD peak.
This is my EW count thus far for the move out of the 75day low. Maybe the last 'b' is not over but the gradually rising MFI supports the breakout from chart one and gives background texture to the fall in the MFi in chart 2. The 1hr momentum study needs to turn up to confirm, but I am looking for it.
Price appears to have tested the 60min bolly band which is my entry zone, cut through a trend line down from the top of yesterday's move and has oversold momentum studies. Add in the positive divergence on the MFI and a rise to the daily pivot should provide cover for any stops on my longs in due course in short order. Other than the shortest Hurst Cycle, the trend band is all bullish here at the moment.
Extended 1-3 day trend lines and a bounce out of the combined 15min and 60 min bolly's has me long with a stop under the low, as an exhaustion play out of a 'b' wave. 10 pips risked to get in. Might have to re-enter on a spike lower but worth ago I reckon.
Wednesday, 17 July 2013
Dow
Missed my exits by 4 pips - what a pain. Could be the 5th up but with all this playing around, I reckon expanding flat just ending 'c' of 'b' out of hours and now 'c' leg down of 4th before the final leg up. We shall see.
Dow - leading diagonal?
This is on the 1min chart - if we get a good slug down about now to about 15390, then I'd be out there and waiting to short the 5th probably tomorrow or overnight. Been a messy, albeit rewarding day.
Dow EW Count
I have a count at last that seems to make sense and fits the earlier posted price targets. I am gunning for an expanded flat in the 4th down to 15331, although I'll take out earlier than that and position for 5th up (unless, it collapses because it is 'c' up and not '3').
EURUSD
If this turns out to be 'c' up or more, then the cluster of the 8hr, daily and weekly bollingers are confluenced at the 50 day (red) FLD peak. This also fits with the Harmonic Octave from last post. Could be a very good day. Already moved stop to break even.
EURUSD
Today's Daily Pivot was at 1.3129, where I banked my overnight shorts. The move up this morning has been retraced 61.8% and is starting the next leg up. Given the move down out of the diagonal last night was a gentle affair, it could be counted as a wave 4 or 'b' wave and thus this next move up could be a wave 3 or C. As such, I have bought in long with a tight stop and targeting anything from 100% of this morning's 'a' at 1.3180 up to the next Harmonic octave at 1.32813.
Dow Jones
Looks like I am getting my welcome relief downhill. The count shown is
for a more bearish picture but ignore that for now (or substitute the
pink counts for numbers if you prefer: 1,2,3....) and focus on the
confluence of trend lines at 15332. This is also the boundary of the
regression channel from low to high, so my shorts are out there until
further clarity unravels either way. Recall, I expect this to be a 25day
low and the 1st in the 100 day cycle, so another rise into the 50 day
cycle would possibly be a good long to take in due course, although as this is the last 100day cycle in the 3rd 80week cycle, it is tense with the 54month low just around the proverbial corner - see yesterday's Cyclic Phasing post for more info.
EURUSD
Second stab at diagonal worked out fine and banked shorts at Pivot this morning. Out for now and await test of top or hold under pivot.
Tuesday, 16 July 2013
EURUSD
Looks like I am going to get another bite of this cherry - larger diagonal unfolding on the 15min/60min bolly perimeter. Looking to short again.
Dow Jones
I have marked out the volatility footprint expected over the 100 day cycle, the first 'dip' expected soon. What we do not know in advance of course is the actual price movement associated with that cycle structure, but the 'v' s help to time decisions on boundary pushes into those bollingers mentioned earlier.
EURUSD
Lovely. Banking this stab down with US open around the corner. Can not read the pattern at all and suspect something may appear that will let me have another go. Just short the Dow as ever and await relief!
EURUSD
Of course, tight entries mean lots of stops and go agains. Looking for kiss goodbye higher up now in what I think is a 'b' of 'b' wave following that ride up last week. I am looking for a ''c' of b' to go back down nearer launch pad before a 'c' up of 'B' before falling to the 100 day low as discussed earlier. I have updated the chart from last week with the count - recall, the pathway was marked out last week!!
EURUSD
Well that worked! Just a quick note about entries. I have been battling the analysis v trading dilemma for some time now, but do feel that once your plan of attack for the day is set, looking for entries as the 15min bolly band pushes up or down to the 60min bollys is an efficient strategy when combined with momentum and volume indicators. The basic premise is that the market pulls back to get the best entry it can (stop v entry price) and both intra day timing and price targets come into focus once price starts interacting with these bollys. Ending or continuation patterns have much more efficacy at these boundaries and seem to have cut my error time down significantly. In that, I mean, I have no issue at all with being stopped out but sitting around for a day or more to bank is not for me unless I am in the money almost immediately after entry and can get to BE asap.
EURUSD
If you are going to try a short, then a diagonal outside the 15min and 60min bollys is not a bad place to look for an entry. These have been adjusted to incorporate 6hours bars and 1 day's bars, respectively.
EURUSD Cyclic Phasing
Matters seem to have followed my pathway for sometime now and I can see nothing to detract at this stage. I believe we are in green 'b' of red 'c' on the way up to complete gold 'B' of the whole correction from the 2008 high. I think the 1st 80 week cycle went long and therefore this 80 week cycle may go short or the next; we shall see. The weekly momentum cluster suggests that green 'b is not complete and therefore any rise now, is in fact 'b' of green 'b'.
The 100 day cycles in this 2nd 80 week cycle seem to have been running very neatly. The 75 day low occurred pretty much as expected but the 100 day low is still to come and that is not due until the 22nd August. I had discussed last week that if the 75 day low was in fact 'the' low, then the 100 day would still likely retest it closely; so for me, that is the low to buy and not this one just gone - the high to come is likely to be the one to short. We shall see.
Dow Cyclic Phasing
Timing zones provided by Cyclic Phasing need to be treated with a lot of flexibility. The March 2009 low was some 15months overdue according to my calculations, although the actual drop in October 2007 began when the low was expected - so late but it still came. As that cycle was long, it sometimes follows that the next one will be short. Indeed the first two 80 week cycles have been short, but now this last one in the 54month cycle is running long, as if to make up for the fact. However, as we stand now, the 54month cycle is not late and the low is anticipated in October, although it might be that we just keep rolling up till then and repeat the drop zone action as per the last cycle.
With this third and last 80week cycle running long, it is no surprise that the 100 day cycles have been stretched a tad! It does appear that the 4th and last 100 day cycle (within the 3rd and last 80 week cycle in this 54month cycle - I know!!) began in June and as such, we are awaiting the drop into the first 25day low. Given the choppy/toppy price action of late, it maybe that the low gets lost in the noise, but the momentum indicators should help to diffuse the matter. I am looking for the blue daily momentum study to drop below the 50% line and as of yet, it has not occurred. Once it has, I'll be looking to buy that low on the basis that a new high may be on the cards and a possible roll up to October as discussed above. If the 25 day low fails to deliver a new high, then we may be rolling down hill quite hard as the 50 day low comes into view in early September. All good fun!
Monday, 15 July 2013
Dow bigger picture
I can not make out the near term picture as clearly as I like as very chop chop,
so I am posting a count but with reservations. The same question as Friday though and that
is, is this a 5th wave up or a 'b' wave of a 4th. I have had to re-jig
the 100 day cyclic phasing to take into account this current structure
and as such, it appears we had two long cycles concurrently. It is
therefore possible that this next 100 day cycle will run short and for
that reason, I am gunning for a triangle overall in the 4th, as time
taken to run shorter legs may 'catch up' on the time factor. For me,
this makes the current leg up count as a 'b' wave overall and thus, I am
looking for a bigger decline into a 'c' wave of the triangle and not a
4th wave of the 5th wave up. Waiting for a turn that helps to clarify. Initial target for shorts is 15300 which hopefully will pick up a 'a' wave of any descent.
Friday, 12 July 2013
Musing on the Dow
We are so close to the prior high at 15540, it would be foolish not to believe the market could go for it in a 5th leg up in a Wave 5. However, until that high is reached, the 'c' wave in a 'B' or wave 2 correction is still on regardless of sympathies and even then could be an expanding flat correction overall. For now, we are coming to the end of wave 3 or 'c' altogether. The prior wave 4 low is at 15256, so I'll take my shorts to there at least and decide what to do at that point. Anything completely different in look and we will know soon enough if this was indeed just correction up.
Wednesday, 10 July 2013
EURUSD
Playing hardball with me today - stopped out again - that is 3 attempts for no gain but no loss either. Gotta cut and run today now as hospital visiting. Catch up tomorrow.
EURUSD
Stopped out at BE but able to get back in again at slightly better price - it is either going up or down and I am hoping for down first to get better price to buy down there. Risk is less than 10 pips which is the goal, albeit not always achieved!
EURUSD
Already at breakeven on that drop - could be a flat retracement for another move up and a higher spot to short if it still looks shortable.
EURUSD
Further to this morning's run down, have sold here as price moves towards top of daily and weekly price envelopes with supporting momentum. Stop is above the last poke there, so tight entry. Looking for return into pink FLD trough and hopefully a failure as ending diagonal creates a new low. Would be looking to buy a new low as per previous analysis.
More technical issue with blog
God help me! For some unknown reason, only the last two entries are showing in the blog roll. You need to go down to 'older posts' at the bottom to unlock the rest. The Dow run down is in there from earlier today.
EURJPY run down
Subscribe to:
Posts (Atom)


