
Wednesday, 12 November 2014
#dax $dax
I am flat this morning, with volatility low, pretty much the same as yesterday's entry price. Whilst that resistance line holds on the 16 pip RB study, I am going to assume price is still in a correction and possibly aiming for 9294, or maybe a bit closer to testing the 9221 low. Catch up later when something happens.


Tuesday, 11 November 2014
#dax $dax
Price has jumped into US opening and is sat right under that Pitchfork from the top. Counting 5 waves up into each 'a' wave in this EW count, and correlating the stoch dip into the 'b's, suggests that we are in 'c' of 'C' or deciding whether 'b' of 'c' of 'C' is over yet. Given the tendency for small connectors in this drive up from the 8351 low, and the placement of price under this resistance line, I wonder whether we are going to see another spike. If so, I reckon the 162% extension at 10038 might be a wave 3 goal here! I am obviously bemused by the small 'b's and would prefer something more substantial to base the counts on, but just in case......


#dax $dax
Well that was a good hours break! banked shorts from earlier cover and see if longs can catch into US open.


#dax $dax
Stopped dead again - not my type of market at all. Perhaps another little 3 waves back to sort this out. Have gone flat again and will come back at US open. Hope my ear hurts a little less!


#dax $dax
Worth considering the pitchfork and ellipse upper perimeter on the daily chart. As discussed yesterday, a break there could see some energy transferred long. The stochs already show a reaction to that zone but no collapse......perhaps a pop and drop, but I'll not assume either!


#dax $dax

 Attempting net longs from here at 9370: looks like 6 swings from yesterday's lows, so one more thrust up before a retracement would be tidy into the hourly price envelope. Any more and it will be grinding up towards the 9555 100% extension from the hourly chart.
#dax $dax
No punch down from the 61.8% retracement from last week's high: have gone flat at 9380 and will try shorts again at 9412 at the 76.4% or lose shorts lower if go there first.


#dax $dax
Price has done very little overnight albeit pushing from the 100% to 123.6% extension of the 'a' wave in a proposed expanded flat. I remain short and will either look for a 50% pull back into the 9290 zone if price action suggests that a retracement down is all I am getting and this is a leading pattern up, or if starts impulsing down, to the 9150-9100 zone, which I covered yesterday although slightly higher. Either way, some downhill to clarify matters would be appreciated.

Monday, 10 November 2014
#dax $dax
Target zone hit from earlier. Longs closed. Now short at 9350 with cover still at 9400. Let's see what the drop looks like.

#dax $dax
I am thinking this is an expanded flat in a 'b' wave up from Friday's low with today's low being the 'b' of that. 9350-3375 would be the 'c' leg of that expanded flat before falling again. Looking for longs up to there and shorts back down...if I don't fall asleep first!

#dax $dax

 Been struggling with an ear infection, so a bit slow in writing up the past two days. I have banked my longs and attempting short positions into 9050. The 4hr chart shows the price envelope starting to flatten out. which suggests a test of the lower channel. It may be that the last cycle low on the hourly chart of 9148 holds, but I think we may see more consolidation before going up.
 The daily chart got overbought on Thursday as price pushed the pitchfork perimeter and went outside the volatility channel, with the median of that channel also at the 9050 area today and starting to rise. Overall then, I am bullish on the Dax but looking to sell into a base in preparation for buying the next rise. Cover sits above 9400 for me today but I'll be banking shorts as profits arise and dropping the cover line. Of course, this bullish set up suggests the pitchfork and ellipse may burst to the upside at some point but for now, they are creating resistance.
Friday, 7 November 2014
#dax $dax
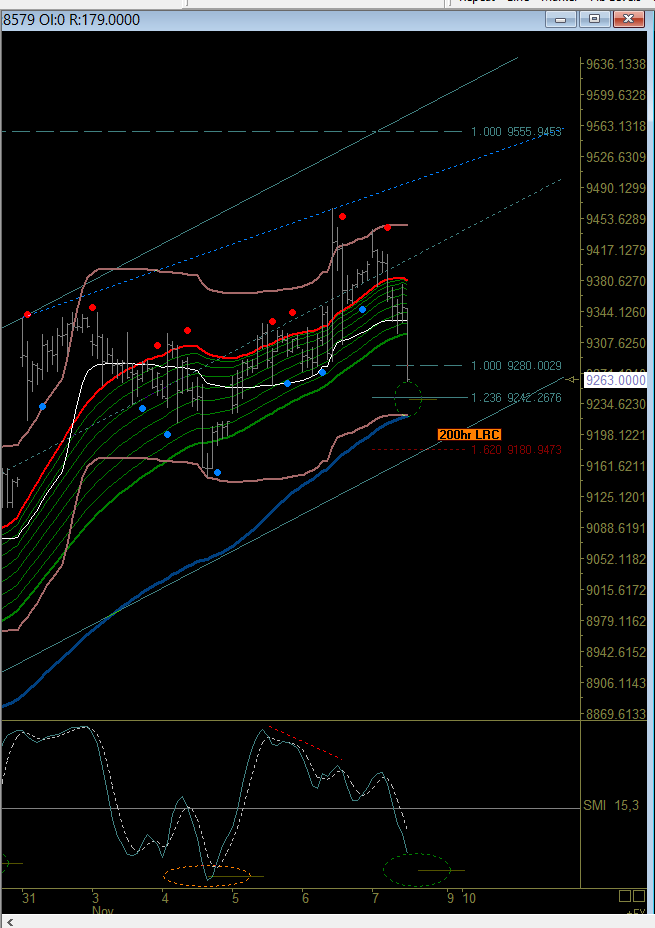
Well, all seems to be playing out according to the cycles discussed earlier. If this is a green circled 'b' wave then the 9148 should hold. We are already at yesterday's low and close to the 123.6% extension of yesterday's rise and fall. If there is going to be a pull up to the 9500-9700 zone, it should be from around here somewhere. I am already long having banked some shorts on the way and hoping to build more on confirmation that the move up has begun. Catch up later.
#dax $dax
I have the 50% of this move down this morning at 9371, today's overall 50% at 9384 and yesterday's 50% at 9367. Looking for an 'abc' into that lot to set up next ride down, unless of course price skips on through.

#dax $dax
At the 76.4% back from this morning's high - not looking tired yet, but shorts banked with 12.00pm candle coming up and all out to wait for a bounce.

#dax $dax
Notwithstanding the targets above, the question continues to be from where will the next strike up occur? My hourly chart shows the connecting 'X' waves in the stochs as orange circles and the 'b' waves within the intervening 'abc's as green circles. Of interest to me is the outstanding green circle time wise and the negative divergence going into yesterday's highs. Although the 9337 line is the 76.4% back of last night's rise, there is still the chance of course that yesterday's drop was an 'a' wave and this rise was a 'b' wave. A wave 'c' into 9270 would fit my need for a green circle, but so would a slow grind through a triangle allowing the volatility channel floor to rise up to price. Either way, I am not too keen on being net long until that hourly stoch has mooched a little lower.

#Dax $dax
It bounced off the 50% back, but I'd prefer to see the lower band of my volatility channel - that would be 9337 where the 76.4% retracement of last night's rise sits. Banked net longs and sitting flat till becomes clear.

#dax $dax
On the 4hr chart, where I keep my EW counts, the pitchfork perimeter off the all time high is directly above yesterday's high. Given the 100-123.6% extensions are directly above there, it does seem that a break up could be dynamic, especially with the resistance line off the top immediately above the latter at 9800. Going to be fun for sure!

#dax $dax

 Well there is a pull back but looks like a retracement of last night's move up. The 100% extension of this marks out a target at 9520 plus, which ties in with the 4hr chart. Let's see if this holds around here.
#dax $dax

 After yesterday's pull back slam dunk to the 50% retracement from 9148, price has meandered back up and is sitting in the 100-123.6% extension of the 'a-b'. However, the 61.8% retracement from 9148 sits at 9260, which is also yesterday's low. Given the time taken to do the rise and fall yesterday, and the placement of the hourly & 15 min stochs, I am looking for that 9260 area to look long for that 9500-9700 zone. Will the market fall in or will it push to the 9500 zone first.....?
Thursday, 6 November 2014
#dax $dax
Having completed a close 123.6% extension of the 'a-b' up from 9148, price has already slammed down to hit the 50% retracement of the whole move up. Bit different too yesterday!! Given the short time frame that took, me thinks it is going lower before having a chance at the 9500-9700 zone. The 61.8% is at 9269, although that maybe too deep - keeping an eye on these stochs for oversold on the 15min.

#dax $dax

 Looking mighty toppy here according to the stochs on the daily - I am past counting more EW waves here and looking to sell strength regardless. The 4hr EW chart shows more needed to reach 9550+ to give 100% extension of blue 'a-b', but I prefer shorting into it from here-on-in.


#dax $dax
Consolidation following the last rise up, appears to be continuing in a flat formation. 100%-123.6% extensions are at the 9252- 9234 zone with yesterday's low at 9223. Will try and lose my shorts nearer there, if this does not morph into a triangle.

Wednesday, 5 November 2014
#dax $dax
I am assuming the reason this has not popped yet is the shorting going on from the last high. Should be some fuel behind anything northbound then.....looking for 9400 and then a correction to retest, assuming this lid gets lifted!

#dax $dax
If that was 'b' back then the 100-123.6% extension sits at 9438-9482. Still got to get through yesterday's highs at 9318 but those stochs look better than earlier and on a 15min instead of a 10min.


#dax $dax

 At the 9318 line of yesterday's high but not a lot of bearish activity yet, albeit there has been an initial rejection. Given this ongoing momentum, I prefer to buy nearer 9250, given the channel bottom on the 10min chart, if the stochs can get into oversold near there.
#dax $dax
Price seems to be looking for that 9300 line. I have the 'c' leg 162% extension of this move up from yesterday at 9301 and yesterday's high was 9318. So unless this is going to extend, I am going to assume the correction down is not over. Even if it is, I am looking for a 'b' leg back to test yesterday's lows. So whilst the stochs look like this on the 10 mi chart, I'll short any confirmation into 9300 -9320 zone, especially whilst MyWave is undecided.

#dax $dax
Short nibbles banked. Looks like price has got a decision to make. Could be sat mooching in this area until overbought conditions on short term charts worked off. Consolidation time? Looking to play bounces into & away from the resistance line above and that support underneath whilst they hold. Catch up later when one breaks.

#dax $dax

 Nice bounce out of yesterday's lows but the 10min MyWave is still in a bearish formation and the daily chart is not screaming get long to me. Nibbling at shorts here.
Tuesday, 4 November 2014
#dax $dax
Looking at the EW count I am running with, this price action does have that 'b' wave feel. Starting to look at the long side again with that 100% extension of blue 'a-b' up at 9551 and the 123.6% somewhat higher. This should conclude either 'B' up or a wave 'A', so anticipate a retest of the move from 8351 which gives plenty to go at to the downside. Maybe not quite yet, but looking for longs on weakness now.

#dax $dax

 A marginal new low this morning keeps my pattern in play from last night. I was looking for a break higher to short again, assuming that the move back up is part of a 'b' wave, so tracking this spike to see if it will keep pushing or will fall again. For now, MyWave is clearly in a bearish formation, albeit into a bullish hourly. Recall, I am looking for price to push down towards the 'blue' MA at the bottom of the regression channel (right chart); that is towards, not necessarily meet it.
 As a backdrop however, the daily chart from yesterday is bearish for me with those stochs pushing into a clearly downward facing MyWave. That is not to say, price won't continue to push up but I'd prefer to see those stochs soften somewhat from here and until they do, I am looking for strength to sell.
Monday, 3 November 2014
#dax $dax
Price has drifted away from today's 50% again, but not with the momentum hoped for. Looks like a pinball lever again, with the next nudge upwards, although maybe only in a 'b' wave rather than a new high, given the direction of the wave here. Anything stronger, that turns the wave dynamically, and then I'll look for longs but for now, shorts higher than here.


#dax $dax

 Whilst the hourly cycle seems to have spent much of its time thinking about matters rather than doing them, it is worth noting the bearish tone now positioning itself on the daily chart. Price looks like it is going to push up a little higher or at least test today's high, but I'll not be hanging around long into this from 9400 onwards or probably anywhere close!
#dax $dax

 MyWave on the stripped down 6 pip range bar study (left) continues to stay flat when it's momentum cycles bottoms out. Given the underlying trend on the hourly chart is bullish, albeit at the top/turning of its own cycle, I keep covering these shorter term lows and banking on a push up. Until that hourly cycle bottoms out, I consider the short term highs for banking the longs and then shorting again. However, I have to keep in mind that the market might want a new high before committing to unravelling the hourly cycle. Tense start to the week.
#dax $dax
No change from Friday's plan: looking for shorts into the hourly cycle low. A very stripped down MyWave sits as approx. 9000, also being the lower perimeter of the regression channel up from 8351. Momentum stepped up in that last rise, so 9200-9100 may contain the action to the downside if this bullish momentum is to be continued.

Sunday, 2 November 2014
Great Guitar Player
When I imagine how good I want to be at converting technical analysis into money ( I know, how crass!) this YouTube video of a college guitar competition caught my eye. Enjoy.
Subscribe to:
Posts (Atom)