
Thursday, 7 March 2013
EURUSD: 10.33am
Consolidate here or break out... I am hoping for the latter and a move to 1.3130 before coming back to test the diagonal perimeter. Will add into the pivot if it falls back under control.


EURUSD: 8.21am
Now that is what I was looking for! Note, even with all this energy, how the Gann Sq.9 lines off the daily pivot provides a useful ladder to work entries with. daily My-Wave obviously got some work to do to turn over but looks like that will be the day's intention. Once price pulls back into a turned over wave, should be safe to start loading up. Price is at the daily DMA now and needs to avoid a complete failure here.  Price has broken back inside the speedline channel off the first 'a' wave from 1.2041 and is now at the monthly DMA. Note how close the daily DMA (thin gold) and weekly trend line are so close together. A persistent thrust is going to see all of these breached which should add energy.
 We are breaking back into the 1.3005 Gann square off the 1.18905 low (still working!) and the next one up is at 1.3302, where the 'peak' of the green channel's DMA sits. I'll worry about whether this has been a correction down from 1.3708 or not when the market makes it clearer. For now, hoping to enjoy the ride a bit.
 Price has broken back inside the speedline channel off the first 'a' wave from 1.2041 and is now at the monthly DMA. Note how close the daily DMA (thin gold) and weekly trend line are so close together. A persistent thrust is going to see all of these breached which should add energy.
 We are breaking back into the 1.3005 Gann square off the 1.18905 low (still working!) and the next one up is at 1.3302, where the 'peak' of the green channel's DMA sits. I'll worry about whether this has been a correction down from 1.3708 or not when the market makes it clearer. For now, hoping to enjoy the ride a bit.
Wednesday, 6 March 2013

EURUSD: 8.48pm
Qucik review of those Gann lines from this morning - look pretty good to me. Again, calc'd off the daily pivot at 12am. 


EURUSD: 7.14pm
I have revised the EW count to show an Ending Diagonal complete and the last couple of days being a 1-2. As such we should see a good leg up now. If not, well, I'll look again!


EURUSD: comparing My-Waves
An impulsive formation -note the two coloured spine and clear delineation between all the lines. Now look at what we just had and what it was attached to. This is why I think it is all corrective and we go up in 'c' now or more if what we are in fact seeing is 1-2/1-2's.
 Now look at what we just had and what it was attached to. This is why I think it is all corrective and we go up in 'c' now or more if what we are in fact seeing is 1-2/1-2's.
EURUSD: 3.17pm
Trying to long again. Price is right at the junction/square bottom off the 1.3708 grid. I have marked out the wave 2 count with a green box. If that was a wave 4 we just had, the rule of alternation does not seem to have been met here. I'll leave it loose, but seems we could count an 'abc/A' up and now 'abc/B' down in a wave 4 thus far, if price stopped on the line.
 We are right on the Monthly DMA having rejected the daily this morning. Just not happy with that wave 4 formation but with hindsight I might need to be. Anyhow trying to go long here till wrong.
 Price is right at the junction/square bottom off the 1.3708 grid. I have marked out the wave 2 count with a green box. If that was a wave 4 we just had, the rule of alternation does not seem to have been met here. I'll leave it loose, but seems we could count an 'abc/A' up and now 'abc/B' down in a wave 4 thus far, if price stopped on the line.
 We are right on the Monthly DMA having rejected the daily this morning. Just not happy with that wave 4 formation but with hindsight I might need to be. Anyhow trying to go long here till wrong.


GANN SQUARE OF NINE
I continue to ask myself whether there is any need whatsoever to do any analysis at all to day trade outside of the very short term charts. This line of thought born out of the need to tighten trading triggers to the absolute tightest possible entries. Here is the calcs utilising the daily pivot only at 12.00am, at 1.40625 degrees. The Daily Pivot and Daily My-Wave provide underlying context to what is happening (going up, coming down or consolidating). The decision to buy or sell off the line of course is key but the stop loss levels need be no more than 2 or 3 pips plus spread for next line up or down returns. Just musing.


EURUSD: 10.25am
Having been long through that consolidation, this is starting to feel full of potential to the downside - maybe a contrary sign that, mind you! Not only are we at the monthly DMA (so testing the wave tail of the prior move up from 1.2041) but also now the first 'a' based speed line off 1.2659. Last line of defence here I think.

EURUSD: 9.51am
Stop held overnight for shorts. Daily DMA & Weekly Pivot failed to the downside this morning so far and price seems to be working its way down through the diagonals drawn off the End of Squares. The bigger picture is however worth bearing in mind. Price right at the monthly DMA again and having already consolidated above it for a week. Notwithstanding EW counts thus far, a breach here could seal the bearish deal, so expect energy either way on a failed breach or one that keeps going!
 The bigger picture is however worth bearing in mind. Price right at the monthly DMA again and having already consolidated above it for a week. Notwithstanding EW counts thus far, a breach here could seal the bearish deal, so expect energy either way on a failed breach or one that keeps going!
Tuesday, 5 March 2013
EURUSD: 7.18pm
Price right up against the blue channel line after the break this morning - perfect retracement within the Gann Grid from 1.3708, if it holds here and drops. Annual Pivot at 1.2903 would be a perfect target. Changed my mind given risk reward, I am shorting here, stop above this morning's high. EW wave count would be wave 4 of C from top, completing here with MACD showing return to zero line. Drop would be the 5th wave down of C, to complete (I hope) a correction, not a wave 1. We shall see in due course.


EURUSD: 6.28pm
Looking like this is not ready to go up as yet. Short term counts look like this is an 'abc' retracement up from the daily pivot. Have banked long bounces off the gann lines and look for a drive down (perhaps to the annual pivot at 1.2903) to try long again. I am not shorting with the 2day SMI where it is on prior charts, and will look to add longs after drives down - so continuing to play bounces above gann lines.


EURUSD: 3.59pm
Some really nice intraday Gann line bounces today - I am counting this as an abc 'b' down today with 'c' up still to come. As long as price is above the daily pivot and My-Wave looks more up than down, I buy the Gann line bounces and vice verser if price below the pivot. 

EURUSD: 2.28pm
This is better price action - price is bouncing away now above My-wave which only makes it stronger. It is still trying to turn up. Price right at the failure point on the Gann grid from the 1.3708 high. If price breaks back in and holds, could get a thrust. I'll be happy around 1.13130 today, me thinks, at the bottom of this smaller degree square. Anything stronger and I'll switch back to the daily chart at 1.3196. Stops are just going behind the Gann lines on the My-wave chart as we rise.
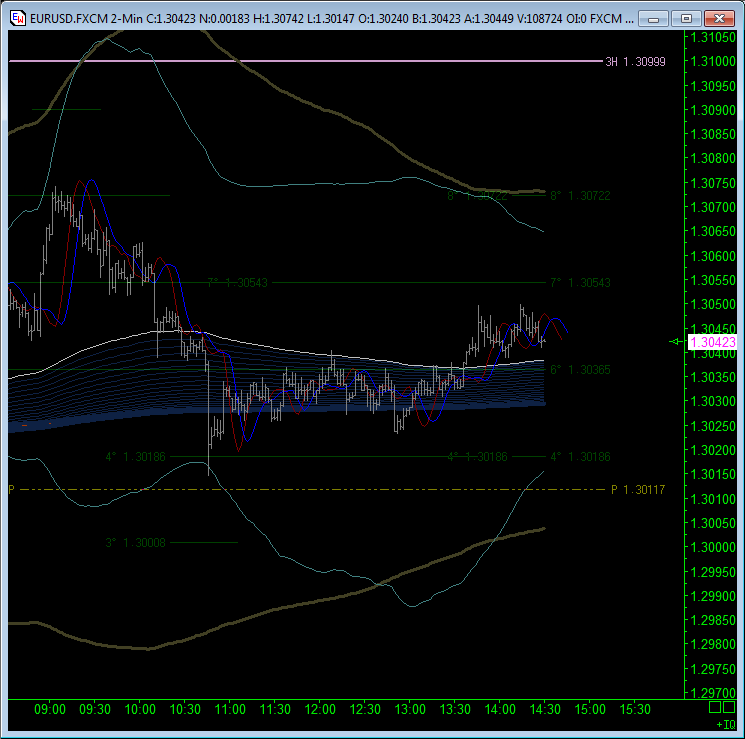 Price right at the failure point on the Gann grid from the 1.3708 high. If price breaks back in and holds, could get a thrust. I'll be happy around 1.13130 today, me thinks, at the bottom of this smaller degree square. Anything stronger and I'll switch back to the daily chart at 1.3196. Stops are just going behind the Gann lines on the My-wave chart as we rise.
EURUSD: 12.06pm
Strong reaction to the weekly pivot there and conflicting technicals from the daily chart, downwards, getting more bearish the shorter term I look.
Daily break of the Gann channel line is still in play to the upside and the MACD/SMi would support a climb but we have been testing the break for sure. The Gann channels off the 1.3708 broke down on that pull back and at the moment show a break to the downside.
 The price action thus far in this move off the bottom yesterday is playing out in the 15min bolly's and has yet to stretch the 60mins. Note the 4hrs coming down from the top and up from the bottom. If we are going to get consolidation at that level, perhaps a bit more bouncing around to play with before the direction is clarified later this week.
 For now price is above the daily pivot and My-Wave is up albeit just about - compressed really and at the very least trying to convince me this is a correction uphill. Lets see if we get another shot at the weekly pivot and what the reaction is. I'll take shorts from there if breaks down again.
 The Gann channels off the 1.3708 broke down on that pull back and at the moment show a break to the downside.
 The price action thus far in this move off the bottom yesterday is playing out in the 15min bolly's and has yet to stretch the 60mins. Note the 4hrs coming down from the top and up from the bottom. If we are going to get consolidation at that level, perhaps a bit more bouncing around to play with before the direction is clarified later this week.
 For now price is above the daily pivot and My-Wave is up albeit just about - compressed really and at the very least trying to convince me this is a correction uphill. Lets see if we get another shot at the weekly pivot and what the reaction is. I'll take shorts from there if breaks down again.
EURUSD: 8.23am
As price wrestles with the weekly pivot, an eye on the gold line above may be wise. This is the daily DMA and marks a line in the sand for upward acceleration. The second chart shows the daily My-Wave and if that is in a bullish position approaching the daily DMA (it's bear tail) then market intentions are probably clearer.


EURUSD: 8.07am
Not a lot to add to last night's post as matters going up for now. Of note overnight however is the Gann calc's off the 1.3708 high which show some resolve at the first test of the break out - see red dot at red boundary. Stops under here now. Still looking for 1.31969 as the next square up on the annual pivot grid (second chart).


Monday, 4 March 2013
EURUSD: 11.23pm
Gann Channel under pressure to the upside now. Straight up to 1.3197 or over to red line on right, either to fail to the downside or bounce up. 3 options, then - as usual. Weekly Pivot based Gann Grid has had tight price action thus far, but weekly pivot looks on as initial target.
 Daily My-wave starting to turn but much to do still to see this stick. Reckon on Weekly Pivot and then back down to bed this in or fail. We shall see.
 Weekly Pivot based Gann Grid has had tight price action thus far, but weekly pivot looks on as initial target.
 Daily My-wave starting to turn but much to do still to see this stick. Reckon on Weekly Pivot and then back down to bed this in or fail. We shall see.

EURUSD: 1.38pm
Looks like the Monthly DMA survived the test again. I could show various time frames building up bullish potential but the daily chart with annual pivot calc'd Gann sq9, is quite clear and at a higher degree than the other timeframes. 2day MACd & SMi are overbought and the 45degree channel line is right at the price. A break above today's daily pivot and we should see a thrust. Plenty of time to buy back into retracements, so will be banking anything over 1.3196 (next square up) or higher if get the opportunity to move stops behind that line. The monthly pivot stands at 1.3273 but the weekly pivot stands in the way of course at 1.3064 and that will probably be where this week's decision is made regardless of my intentions, as that is where the 45degree line stands today.

Just about to go through 6000 visits
Thank you for everyone who has taken the trouble to visit the blog from time to time. It continues to evolve of course, but any positive input from the readers would be gladly welcomed.
EURUSD: 7.31am
Price retesting monthly DMA but all momentum indicators still looking for relief. The daily chart has a clear Gann Square channel in play and a cut through the blue line to the right should see upward thrust. Until then, wary of fall through the MDMA.
 The daily chart has a clear Gann Square channel in play and a cut through the blue line to the right should see upward thrust. Until then, wary of fall through the MDMA.
Saturday, 2 March 2013
EURUSD: Weekend Summary
Chart 1: Monthly trend is red for down but price has made it to the monthly trend's Displaced Moving Average; at this point the prior uptrend is at the crossover with the tail of its own wave. So is this a retracement 'b' leg from the 1.3708 top or not, and even if it is 'a' or '1' down, there is still the retracement up to contend with. Well we got a good bounce Friday night and we were into the consolidation zones from the leg up from 1.2041 (see smaller and large triangles to left of price) but there is a bit more to do to get things turned around to help us with the answers. Chart 2: The 40 day price envelope has more room for price to fall but even so, an 'abc' maneuver might be expected to put a kink in this downdraft at least. On my mind is the continuously overbought SMi and the fact that the channel's own Displaced MA is already late in it's 'trough' and in fact is approaching a bit of a upward bump - this would be a bottoming 'peak' if price were below this line, so although perhaps a good place to touch, maybe up first, then down. Certainly the channel as a whole is turning down and if this is to hold, I would expect price to meander over the the other side to test the validity.
 Chart 3: The shorter term channel is the same green 'inner channel' on chart 2. This has been pushing the bottom perimeter for a week now and is showing positive divergence on both the MACD & SMi. In addition, this channel's own DMA is showing a 'Peak' which will act as a magnet. The top of the channel at present is in the 1.3400 area, which would put price above the median line of the 40 day channel in chart 2 and start to test the motive of this whole move down.
 Chart 4: Whereas charts 2 & 3 utilise channels tied directly to the price action, this chart uses fixed time lines for trend cycles for comparison. The storyboard is the same however. On a monthly basis, the trend has turned down, but has not crossed its own DMA (yet!!). To the right is both the daily and weekly DMAs and if these do not hold when tested, price will be above the monthly trend line. These indicators do not lag price action - they are very fast and do represent the median of the daily, weekly and monthly price bars. The only 'wobble' factor to be borne in mind is that the lines are medians and price will vibrate within the high low range of those price bars, around these Lines in the Sky. Friday's question really was, "will the monhtly DMA hold or not?"
 Chart 5: Here is the Gann Sqaure of 9 grid (pyrapoint on Ensign)calculated off the monthly classic pivot of 1.3273. I am using this as the matrix to follow my intraday My-Wave around the storyboard, created in the series of charts. I was looking at the weekly pivot but there is little variation in the numbers to the monthly and this needs less work building. The bounce off the monthly DMA can be seen quite clearly here and how accurately too. Immediately above is the daily DMA (now in expanded wave formation) and the weekly trend line. A gap up on Sunday night will put the cat amongst the bearish pidgeons but similarly, if the monthly DMA cracks, then big popping sound to the downside! Decision time indeed.
 Chart 6: In the shorter term, the My-Wave (red/blue) bounced above its own DMA (green) and hopefully sets the tone for Monday. If the My-Wave loses its DMA again to the downside, well, I'll follow it downhill instead.
 Chart 2: The 40 day price envelope has more room for price to fall but even so, an 'abc' maneuver might be expected to put a kink in this downdraft at least. On my mind is the continuously overbought SMi and the fact that the channel's own Displaced MA is already late in it's 'trough' and in fact is approaching a bit of a upward bump - this would be a bottoming 'peak' if price were below this line, so although perhaps a good place to touch, maybe up first, then down. Certainly the channel as a whole is turning down and if this is to hold, I would expect price to meander over the the other side to test the validity.
 Chart 3: The shorter term channel is the same green 'inner channel' on chart 2. This has been pushing the bottom perimeter for a week now and is showing positive divergence on both the MACD & SMi. In addition, this channel's own DMA is showing a 'Peak' which will act as a magnet. The top of the channel at present is in the 1.3400 area, which would put price above the median line of the 40 day channel in chart 2 and start to test the motive of this whole move down.
 Chart 4: Whereas charts 2 & 3 utilise channels tied directly to the price action, this chart uses fixed time lines for trend cycles for comparison. The storyboard is the same however. On a monthly basis, the trend has turned down, but has not crossed its own DMA (yet!!). To the right is both the daily and weekly DMAs and if these do not hold when tested, price will be above the monthly trend line. These indicators do not lag price action - they are very fast and do represent the median of the daily, weekly and monthly price bars. The only 'wobble' factor to be borne in mind is that the lines are medians and price will vibrate within the high low range of those price bars, around these Lines in the Sky. Friday's question really was, "will the monhtly DMA hold or not?"
 Chart 5: Here is the Gann Sqaure of 9 grid (pyrapoint on Ensign)calculated off the monthly classic pivot of 1.3273. I am using this as the matrix to follow my intraday My-Wave around the storyboard, created in the series of charts. I was looking at the weekly pivot but there is little variation in the numbers to the monthly and this needs less work building. The bounce off the monthly DMA can be seen quite clearly here and how accurately too. Immediately above is the daily DMA (now in expanded wave formation) and the weekly trend line. A gap up on Sunday night will put the cat amongst the bearish pidgeons but similarly, if the monthly DMA cracks, then big popping sound to the downside! Decision time indeed.
 Chart 6: In the shorter term, the My-Wave (red/blue) bounced above its own DMA (green) and hopefully sets the tone for Monday. If the My-Wave loses its DMA again to the downside, well, I'll follow it downhill instead.
Friday, 1 March 2013
Pyrapoint Grid for EURUSD
Below is this week's Pyrapoint Grid (based of Gann's Square of 9) utilising the weekly Classic Pivot calculation as the base number. All the horizontal lines are placed on the grid for Monday morning's trading. I have been getting more and more comfortable with the lack of any need to forecast anything using this analysis and for next week, I am going to trade blind using this and the intra-day waves. I'll post as I go along. For now, the weekly trend line sits at 1.3160 and price is breaking out of the downward channel from this morning. I am playing long to the trend line.


EURUSD: 6.59am
Well, that is the 5th day at the Speed line channel perimeter. No need to change my counts at all thus far but with this being a new month, it would be usual to see a reaction. Still looking for up to seal the bullish deal, but it is very tight now.


Subscribe to:
Posts (Atom)