Disclaimer

Disclaimer: This blog should be read as a 'whiteboard' of my daily thoughts and ramblings and specifically not, in any way, advice to trade. My interpretation of the works of Gann, Goodman, Fibonacci, Elliott, Hurst et al; is entirely my own and should be read as such. Any opinions, news, research, analyses, prices, or other information contained in this report are provided as general market commentary, and does not constitute investment advice. I will not accept liability for any loss or damage, including without limitation to, any loss of profit, which may arise directly or indirectly from use of or reliance on such information.

Tuesday, 8 January 2013

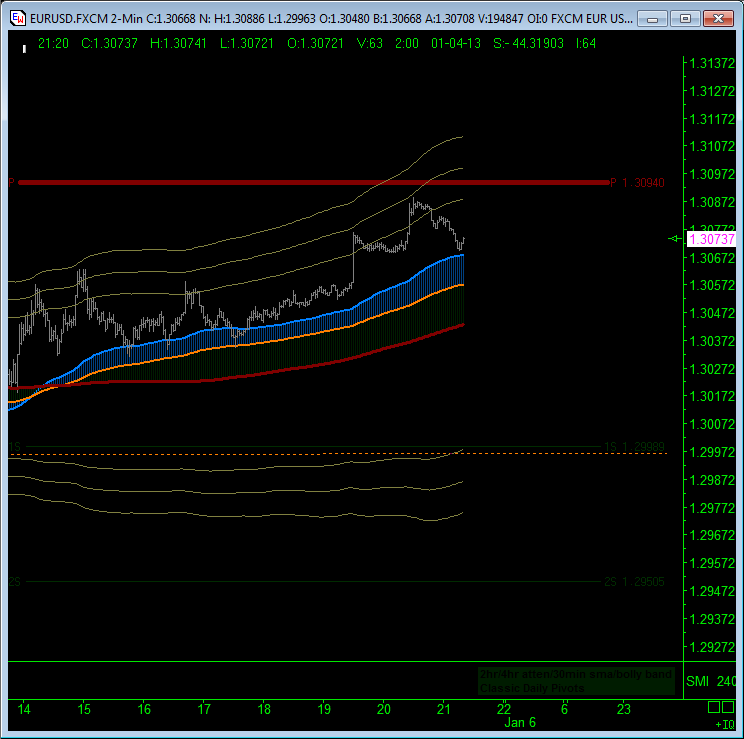
Looking like an ending diagonal
30min SMI looks like a 'b' wave and the forecaster is calling a top ahead in time now. D3 from here?
Going for D3 would provide a backtest of D8. Just need that ED to pop!

EURUSD: 2.11pm

Very nice too - have banked shorts here and wait for SMI to reset. Will look to buy this if price gives me a higher low within 5 pips of the low at 1.3067 or lower if descent continues.

EURUSD: 11.46am

Well nothing going on but minor pulses here within 30min bollys. Even my puppy Gracie's non-stop scratching of her bed is more enjoyable than this!
D1 or D2 - market will decide one way or another, even if it is more sidewards into the apex ahead.
Down to D1 would cut D6 and put a possible head and shoulders on the table. Upwards and through D2 and maybe another pop at D8 then D9, although the SMI's do not seem to support this.

Dow: 8.13am

The SMI forecaster called the turn exactly last night but the downside move was limited by the 30min SMI placement that was oversold already. This is why I closed out yesterday. However, the 4hr SMI is now in the bearish position and the forecaster is not showing a change in mood anytime soon. I am looking for D1 to be revisited and the 30min SMI to be at the top of the sub-chart. If the 4hr SMI stays rooted, we may have a great place to short again.

EURUSD 8.04am

So far so good. D2 had been working through a bottoming formation and is on the wane now, allowing D1's topping zone to pull price down. The intra-weekly My-Wave is still bearish but D3 is also working off a bottoming pattern and therefore the depth of any retracement here may be held up by that D4/D6 confluence below and the regression channel perimeter. The 30min SMI looks tired already, so keeping my wits about me here, I hope.

Monday, 7 January 2013

Dow 5.57pm

Closed shorts on Dow for now and wait for 30min SMI to recoup some strength and price to be both nearer/into My-Wave and higher up in the Bolly channel.
Have topped up shorts on EURUSD where 'c' of A or 2 looks sooner rather than later. Bottom of that green regression channel would make a 'b' and up again from there as per weekend report. SMI forecaster looks like 'b' wave down then 'c' up in 2 for my game plan.

Dow 5.09pm

Been looking at that SMI forecaster wondering why an oversold 30min SMI is going to succumb to further declines - that gap of course! If price can not be held up by D4/D3 confluence at T4, then the gap is fair game. This would get price to D2. Still no bottoming timing appearing on the forecaster - all downhill for me.

EURUSD 4.37pm

As per weekend summary, EURUSD has made it to D1 with an overbought 30min SMI and the 4hr down below. Fading short here for possible 'b' wave back down or more!

EURUSD: 1.53pm

Do read the weekend summary for the background here. We are coming into the D2 topping zone and D1 bottoming zone. From the daily charts we know price has been working both the D6 bottom and D7 top consecutively, so lots going on. My thesis is that if D6 holds and now D1 to the downside, then we should see D2 et al come into play. There is no bottom signal coming into view yet on the 4hr SMI forecaster, so looking forward to a reasonable decline unless D1 is retaken to the upside for a move to D6. Is this check or checkmate?

DOW:7.41am

Price has made it to D1 and is running up the top side at present. A breach could see a sharp drop to D2. SMI unwinding oversold conditions overnight but My-Wave is strongly up for now. Keeping my eye on that SMI forecaster. Will the top hold?
Intra-day My-Wave has turned over to the downside and with strength following Friday night's crack. Need a consolidation pattern and lower highs but D1 is the key.

Sunday, 6 January 2013

EURUSD: weekend summary

Well, we got the D8/D9 confluence bounce and now we are rightly pushing D6 - A failure of D8 means D7; a failure of D6 means either D7 or D5 (as both are lower). So, D6 is key. If it is going to fail, I assume the market wants to be as short as possible for the move and that probably means price consolidates for a bit as the market gets its stops in the right place. As D10 failed in September 2011 and D9 has thus far stopped a move back to it, D11 could be on here, not just D7. The SMI forecaster has not called a bottom yet at all ahead in time and there is plenty of meat left in the SMI cluster for now. However, My-wave is far from turned down here and D6 has held so far. With D8/D9 overhead, price could be bouncing about for a bit until that My-wave squeezes.
Looks like a leading diagonal with My-Wave clearly bearish. But price is bouncing out of the 8hr bollys and I think initially to D1 for an initial rejection in 'a', nearer T4, for a deep 'b' wave there and then back up again for 'c'; rolling along the D4/D6 lines, maybe until D2 or even D3 have been touched again, in more consolidation. I have seen these long winded decision points so often with this pair so going to assume the same for now. I'll try and be ready to wave 3 down when it comes and hope not to miss it.
The intraday My-wave is bullish here and the last low is at 1.2996. A drive down to within 5 pips either side, combined with the SMI in the 2nd chart above in the oversold position, maybe worth buying if the My-Wave holds to the upside. This might pick up a 'c' wave up. Pennies from in front of buses perhaps but will keep my eyes open.

FTSE100: Weekend summary

Price is pushing the weekly bolly band here hard with negative divergence on the daily SMI. Price has pushed past D9 having apparently backtested D10 on the 16th November but where is it going? The sequential targets are either D8 or D10 and both of these are not northbound. My-Wave is bullish here but no place to be going long me thinks. A failure of D9 is needed to get this truck moving downhill, so for now I am more focused on the Dow while D6 holds above. It maybe that the Dow and FTSE fall together of course.
The 8hr bollys are also being pushed hard here with a bullish My-Wave but the SMI clusters call for at least a softening of prices near term. Definitely no place to chase buses uphill for me. The forecaster seems to be suggesting there is another momentum push coming after a drop which may be the approach to D1 unfolding - double top perhaps? D1, D2 & D3 all sit at 5950 currently, so maybe matters get clearer there. It looks like a top is building for midday Tuesday.
So bullish intra-day my-Wave in need of some bearish attention to get matters moving southbound. Same as the Dow in needing My-Wave to turn down, D1 to crack, etc etc. Be interesting to see what the early week brings.

Dow: Weekend Summary

On the 1st May 2012, a backtest of an 'A-B' line failed to the downside for a 1339point decline. At the beginning of that decline, My-Wave was completely formed to the upside, but the breach of D6 meant a meaningful push for D7 was on, as we had been in a D7 topping formation (the light pink trough). Passing D8 along the way, meant extra momentum for D7, but the weekly bolly bands and D10 combined held price well with the SMI cluster bottoming out. Note how the gold forecasting SMI topping too - this is a displaced SMI, so works the same as my displaced 'D' lines, in reverse of price action, but way in advance. That success at holding and crossing D10 in June 2012 sets up a move to D11 via a retest of D10 as it tops out (forms a trough). Can you see where D10 and D11 sit in respect of price? We are currently backtesting the larger 'A-B' line set up by that last D10 poke but this time My-Wave is very weak - not quite formed to the downside after that gap up but almost. D6 and D7 were taken to the downside in a trend line breach on the 7th November and then D7 was quickly retaken again. Thus far D6 has not and is in fact providing a retest in a bottoming zone. If it can not be retaken in a bottoming zone (a peak), then the topping zone of D7 is likely to take over. If D7 fails, then D8, then D9...... Recall where D10 and D11 are. We have negative divergence at present on both my daily and weekly SMI's and the forecaster is looking for a selling momentum ahead. However, we need price action to shift downhill or else this lot is just wind!
Stepping down into the 8hr bolly environment and we can see the lower order My-Wave is not looking so bearish after the gap up and holding price. D6 sits above as in the bigger picture chart and currently above D1. We are not going to see any cascade downhill unless D1 fails. I have been imagining the route if it does: D1 lurches down to D2; as D3 and D4 are above D2, we then get a pull back to there and then a fall to D5 at 12675. This is 100 points lower than D7 from the last chart. So maybe it keeps falling through D8 and D9, which would be deep into the weekly bolly bands at 12300-12200, before catching its breath. If the fall in May 2012 was 1339 from a bullish My-wave, what will a move from a bearish My-wave provide. Me thinks, D11 or D10 at closer to 10000 is on here but again await proof. The forecaster shows a distinct turn for the worse about 6pm tomorrow GMT, which may see price cut through D1 but initially rising into its Peak from the underside. We shall see.
The trading chart shows a possible diagonal and an initial tremor Friday night. It is very choppy, overlappy and in the right place to be what I want it to be but the short term My-Wave is clearly not in agreement yet. Really need to see the My-Wave turn down and then for price to rise up into the top bolly band with a lower high to be perfect entry. I am too impatient for that here and have started fading short.

Photograph: Over the wall

I did not bother taking the camera out today; the weather is so wet and misty that I'd struggle to find anything to focus on. I did miss a couple of great cobwebs but that was about it. I took this photograph before Christmas and had almost got home without a shot. I peered over a wall and found this stunning array of pink flowers. Thank you Mr Gardener for the effort here. Photograph: Over the wall. If you have time, do look at the album building up in the left hand side navigation link - starting to become a good collection, I think.

Friday, 4 January 2013

Dow 8.34pm

Well that spike up has taken out the last high: is this an ending diagonal in a 5th, just before Friday close?
Looking like 5 waves inside that leg up in the SMI. Short into weekend.

Dow: 4.48pm

Been watching this all day - Looks close to me. Expanding Diagonal at end of what looks like a corrective 2. Looking for thrust down.

EURUSD: 7.48am

Well, so much for being bullish last night! Price has moved down through D6 making D5 a likely target.
On the bigger picture chart, D7 comes into play.
However, I am looking at the Dow which seems to have played its D6 retracement and may now look to D7 and beyond with D8, D9, D10 & D11 are all stacked below for possible cascade.
I a hoping for an initial move down to D5 as the shorter term gate keeper.

Thursday, 3 January 2013

EURUSD: 3.01pm

I'll post charts now and come back later to explain. Still bullish here.

EURUSD 10.57am

Pushing the 127% extension - given the 100% earlier got so much attention, me getting more comfortable with impulsive leg coming to upside. Just need some proof now! Positive divergence on both SMI indicators and no 'bottom' being built yet on the forecasting SMI - will discuss this later.
Looking like an expanding diagonal to see this leg off. Stops taken for breakeven at 1.3131; now looking for something lower here.

EURUSD: 8.12am

Price seems to be back-testing the 100% extension of a very flat 'A-B', as suggested yesterday. I closed out my shorts after the 3rd wave down and have been looking to go long into the forecasted bottom from the displaced SMI - see yesterday's post. We now have a forecasted 'top' ahead. I have drawn in the 85.4% fib fans for the waves down in proposed 'C'. Looking for price to at least reach these in the next SMI cycle up or break them to the upside.
The drop from D2 has left price in a void here with D4 below. The SMI clusters however suggest time is up and back up to T4 perhaps - again! I have drawn in a regression channel to the low, so lets see if price breaks the perimeter or continues down.
Price appears to be testing that 1.3133 area in detail and next will have to be the daily pivot. This wave sits on top of the My-Wave in the first chart, so needs to turn over completely to the upside to give new life to the bullish case. Given the possible flat correction, I preferred to close the shorts early and give the longs a chance. We shall see.

Wednesday, 2 January 2013

EURUSD: 5.51pm

(chart updated with EW count, 6.26pm) Monthly My-Wave still not looking too bothered by this move down. In fact, it can be seen that a very flat 'abc' may have been playing out and 1.3133 may be the 100% 'c' wave, although it could just be the first wave down in 'c'. There is another top forecast shown in the SMI panel, so I am looking to go long into any break up above D2, in case it is done already.
Looks like an ED in the 1min chart, so happy to take a punt on the SMI forecast. The partial wave in this chart is the crest of the monthly My-wave from the last chart, and as can be seen, it still is not unwound to the downside. Bull and Bear positions have been profitable but I am looking to be net long based on the current situation. Looking forward to seeing what the SMI cycle uphill can now do.

EURUSD: 4.45pm

30min SMI looking extended here. Have banked half and covered the rest of the shorts and will look for a consolidation pattern/retracement to appear, hopefully underneath D2. If D2 breaks again and holds to the upside, I'll try net long again as prior low still in tact. Bouncy bouncy.

FTSE100: 4.24pm

The Bubbly FTSE popped from D5 right past D1, D2 & D3 leaving a useful short term retracement target for those SMI's to unwind. But the sequencing target of D5 is D4 or D6......now where would they be? Short I am!
And where is D7 & D8, if D9 were to fail on the bigger picture? Still short I am.

EURUSD: 4.18pm

Having spent most of the day thus far banging away at D3 and D1, price has reached D2 in a hurry as hoped for this morning. If D2 fails, then D4 is the next sequential target of D3 which looks do-oable before that forecast low marked out in the sub-chart. Stops at breakeven and riding this baby down hill as far as she goes.

FTSE100

That is looking like an ending diagonal to me. Looking to short this pattern.

EURUSD: 8.37am

As noted a couple of posts back, T4 had not turned down before the New Year and the monthly My-Wave was still constructively bullish, thus the spikes down were used to release shorts and edge long. Target was reached overnight along with an overbought 30min SMI and a forecast of a low to come on the 4hr version.
Looking at this apparent ending pattern on the 1min chart and the previous high at 1.3307 still in tact, I'll be looking to short from up here until the SMI has reached bottom and then reassess the motives.

Tuesday, 1 January 2013

Dow Industrials: Big Picture

The monthly SMI in the subchart (red/white) has been overbought for sometime and if this line can cut the gold one to the right, there maybe some life still left in this bell weather before the cards fold. However, the gold monthly displaced SMI is currently calling a bottoming zone beginning the end of 2013 (this year!!) This requires the red/white SMI to descend to the bottom of the sub-chart to fulfill the forecast. We are already through D1 and sat on top of D4, which of course is out of sequence to the natural order of things at D2. If D2 can not hold at 12250, then D3 is a lurch lower at 10000. Big issue for the market however, is that getting to D3 bypasses D5. Now look at where D5 was in the order of things at the 2009 low - it was a massive anchor for the market as it was still rising at that point. Re-taking D5 back then, meant a likely return to D4 as opposed to pushing on down to D6. We are sat on top of D4, so the forecast has been fulfilled. The natural sequencing for D4 is D3 or D5, but D5 does not look quite as resilient in its current position to me as 2009 and the next stop at D6 may just be the ticket to buy via D3. This sits at the 127% extension of the possible 'A-B' on an analogue scale as shown in this chart. On a log scale it is a 162% extension. Happy New Year!!

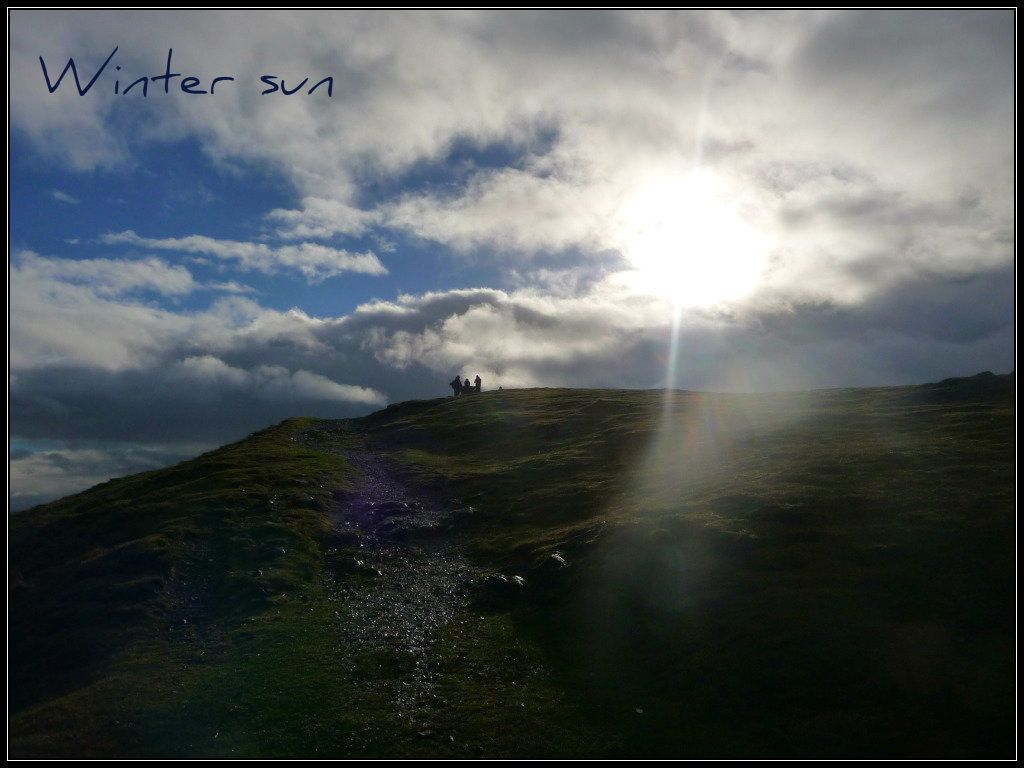
Photograph: Winter Sun

Not a lot of anything but rain over the past month but the odd hint of a glint of sunshine and I just gotta get a picture. Could not see a thing when I aimed the camera at this but happy to have caught this rare moment in Malvern of late! Photograph: Winter sun.