
Tuesday, 11 December 2012
EURUSD: 9.56am

EURUSD 9.38am

EURUSD 7.31am


EURUSD: 7.00am


EURUSD: 6.43am


Monday, 10 December 2012
EURUSD:7.34pm
What a mind boggling boring day. However, under the surface, me thinks all sorts is going on.
 Let's look at the bigger picture first on the 240min chart. Look at that SMi cluster covering up to 12hrs at the bottom. Them's got to get back to the top to create a sell opportunity for me. In the interim, if we had a 'B' bottom like I think we had, then these SMI's should confirm the turn up. Also, the troughs of D4 & D6 are on the wane now; they caused the drop as I had been discussing over and over - under the 'sick goose' banner. As long as price sustains that bounce off 1.2878, we should be going up and a 'cut' of D5 should be matched in time and price travelled on the other side of the line from where the move started Friday. So my 'i' maybe a bit spikey, but other side of D5 is what i am looking for.
 On the shorter term chart, this sidewards action appears to be crossing over the D1/4 trough (the weak zone for EURUSD or topping area). Basically, rather than going down, this topping zone is causing price to go sidewards. So why would the topping zone on D1/4 cause price to go sidewards and not down?? Well, that be because D1 & D2 are in consecutive bottoming zones right now and they are 4 & 8 times bigger in trend power than D1/4. As the orange trough wanes this evening, we should see the power of D1 & D2 pull price up into the red channel again. As D3 & D5 are flat, they are prone to being cut here but revisited from upstairs down later once D1 & D2 go into topping formations.
Lets see how this pans out then.


EURUSD: 4.04pm

EURUSD 3.09pm


EURUSD: 1.51pm
My-Waves over 3 time frames:
 For the trend to hold on the lower time frames, the daily has got to rollover. In order for it to roll over, price has got to stay above it. The first obstacle is immediate pull backs which seem lacking this time around. Still, a push up and then a retracement into the 'turning' wave is to be expected in due course. So looking to bank nearer 1.3000 as stated earlier.
 4hr My-Wave is bullish here but having to pull that daily one with it. Expect this to tire at some point as a result.
 The hourly My-Wave will signal weakness before the 4hr fails.


EURUSD: 1.23pm
Price action would seem to have moved along somewhat. Much better when it is moving and not basing! The 85.4% fib fan of the 'a' wave of that move down from 1.3126 is the green dashed line slicing through the red channel of its opposite number for the bulls. That green dashed line is also at the next blue fib fan parallel of the 'a' wave up from 1.2659, that battered price back into a retracement Friday after the stab up. Seems to me, that there is likely to be some acceleration again after that is beaten (if beaten!), maybe sufficient to punch right through the D1/D3/D5 confluence that might end up being a wave 4 consolidation zone for this move up, with a push to D2 as wave 5. If we get to D2, we will also have beaten that white My-grid line and I think that will seal the count for me to the upside. First things first though; lets stay above the daily pivot and get past that 1.2941 Gann line.


EURUSD:11.33am
Nearly four hours of testing that first parallel line of the 85.4% fib fan from Friday's low to stab high. If it continues to hold, that is starting to look like a steep channel. Overlapping waves may signal leading diagonal and need to bank top perimeter/lower lows combos.


EURUSD: 9.19am
Monday mornings!! Nothing broken in my weekend summary although pushing my stops for sure overnight. Quick overview before we get going today.
 This is the My-Grid from the 1.6037 high. First attack at that perimeter wall, got knocked back but next time should seal the deal (or not!). See how the monthly My-Wave remains bullish.
 The Hurst Cycles study I am running suggests we are coming into that 20week low pretty much as forecasted weeks ago. The numbers are not EW counts but interactions with D6 - the red line.
 We are low into the T4 price envelope with T4 now sat at approximately 1.3075. Price has been taking a very good look at the 1.2878 Gann line and SMI's would support a return to T4 as an initial target. Do note how T5, T6 & T7 have all been backtested here, with a push above T4 likely to pull all of these into a bullish stack.
 The Daily My-Wave now looks properly formed, albeit without a lower low there. A break above the daily pivot and the orange D1/4 should get this wave going up after all the backchecking of the Gann line.
 That D1, D3 & D5 cluster looks a good start at 1.3000 area which was my target from Friday and if it takes that down, an acceleration to D2 at least and into the T4 area. New white My-Grid levels for the move down from 1.3126. If it does not hold, the line above should be on at 1.3250. The red channel is drawn off the stab up Friday, which thus far is holding that low.
Onwards and upwards but 1.3000 first will be fine for me today.


Sunday, 9 December 2012
Photograph: On top of the world
What a spectacular day we had yesterday on top of the Malvern Hills. This was Gracie's first climb and albeit we went in zigzags and via lots of 'curly coat conversations', we got there in reasonable time. Photograph: On top of the world.

Photograph: Moon
I was out doing the 'bins' and as I turned back towards the house, this 'eye' was staring back at me. Tell the truth, it did not quite look like the photo. Try as I may, I could not get the image I was seeing to be replicated by my digital camera. The sky was completely filled in all directions with mackerel'd clouds of various blues and this moon peeking through like a cosmos eye, eyeballing me doing the bins! Anyhow, hopefully, you get the idea. Photograph: Moon.

Saturday, 8 December 2012
Weekend Final Chart

EURUSD: weekend summary
The great thing about weekends is that the market takes a break from printing price bars and I can sleep on what has happened over the past week. Now that I have figured out a better way of posting charts, I am going to try a quick run down this weekend using just My-Waves over different timescales.
 Big count then: we are in the 'b' wave in 'C' up from 1.2041 or it is over already. The 'B' comprised of an 'abc' which was close in time to the 'A' wave. The slight time discrepancy is highlighted by the solid- to-dashed lines to the right of the screen. End of year target for end of 'C'. My count, so no matter if wrong as only big picture stuff and I don't trade this anyways. However, note the possibility of a fractal 'hint' within the 'a' wave of 'C' - I have added coloured bars to coordinate 'A' & 'B' with what might be happening in 'C'. Just musing. Can you see what I see and is it worth seeing?? Note also that the monthly My-Wave has not turned down but merely compressed so far and if the fractal is right, 'b' maybe over already.
 The weekly wave has also not turned over, although it is doing a blimming good job of getting there. That is either 5 waves down for 'a' or 3 of 'a' or it was all of 'abc' for bigger degree 'b'. I am keeping my options open here in light of that fractal hint in the last chart, but like the last option. My eye is drawn to that reversal pattern and the power of the initial climb Friday. Market would be scratching head if it just kept climbing. Look again at the 'a' wave in 'C' in the first chart. This is why I play the small degree waves!
 So, the daily wave. It is still clearly down hill and does not sport the usual sidewards 'pinch' of a 4th wave yet. Given the messy second wave above (or was it the 'b!!') it could be the 4th wave down is now in play as a spikey zigzag for alternation. I think that was a 'b' wave (or '2' up) on Friday evening, so will be playing for up on Monday morning as 'c' wave minimum and go from there. What would not amaze me would be a out of proportion spiker uphill to take out the daily wave in one go. See above for why.
 I reckon the fractals are rolling down to these smaller time frames. Compare that 'a'/'b' from Friday and then look at that first chart again. Ummm. I am comfortable trading uphill for now and my stops are below the Friday low. Lets see what happens.


Friday, 7 December 2012
EURUSD: 6.16pm


EURUSD 1.45pm


Photograph: Tree
Not the most exciting of subjects perhaps but look at the shape of this beauty. The Malvern Conservators do a lot of hill management, felling trees and clearing hillsides for instance, and this may have been a grower after a chopping. Struck me as very mangrovey and goes into my collection as Tree. If you have not put the photographs on slideshow yet, might be worth a go. Looks good to me. Try the quick navigation links on the left.

EURUSD: 9.18am

EURUSD: 6.28am
Good morning everyone. During that Ending Diagonal last week and this, all I kept thinking was "if only we could get a retracement". Well we got one, or perhaps part of one. Rather than worry too much about the 'count' I prefer to acknowledge that the next wave always helps a little bit more, so why not defer the anguish too. The 'D' lines help in that regard.
 We are at D1/4 in what looks like a wave 4 & 5 overnight for the leg down yesterday. The Daily My-Wave has stayed in formation and descended to the price, which would enable any move up to start eating away at its bearish integrity, although slow and choppy would be likely be a retracement ('b' wave). Anything spikey that leaps across the My-Wave and maybe the retracement is done. It is a bit too early to confirm D1/4 is beat but certainly causing price to act.
 Again, very little pip movement since mid-afternoon yesterday and price action has done a good job thus far of using that blue My-Grid line as resistance. A move up to D3 would see price over the D1/4 (orange line) and into the move up. With D1 cut on the way down, a return to D2 is likely but only if D3 is taken out to the upside. If that is achieved, D5 will have been retaken again and that brings my bigger picture ideas into play from last night - perhaps have a look at those.
 The 60min SMI cluster is looking tired here now, which would support any move up. price has managed to tag T6 but not T7, keeping the upside bias alive perhaps, but T4 is looking like it is turning there to the downside. Price however is at the deviation band of the price channel, so a return to T4 would look right at the very least. If price meets it whilst it has begun descending, then maybe time to short again there. For now, playing for up and assess matters along the way. Have a good day everyone and great to see you following along.


EURUSD

Thursday, 6 December 2012
EURUSD: 8.10pm

EURUSD:5.30pm

EURUSD: bigger picture

EURUSD: 4.21pm


EURUSD: 3.06pm


EURUSD: 2.55pm

EURUSD: 1.58pm
Closing here at 1.3030 as just about approaching D5 as a successful backtest. Could go further of course but that is enough thrust for me to be wanting to see the response!

EURUSD: 11.30am
Last night when I went short, the retracement from the assumed top to bottom was 45%. I had said that this was a little light but there was potential for a drop, so I took it. I am counting an 'abc' down to 1.3044 for the 'A' wave (which is what I drew the green My-grid off) and then up to the recent high at 1.3085 as the 'B' wave as an expanded flat. Of interest is that this thrust took the retracement up to 50% of the assumed 'A' wave. If we are now in 'C' down, we have a variety of targets, but the 127% ties up neatly with D3 at 1.2981 and the 162% with the blue grid line at 1.2953. I like this latter one because it is deeper and is just above that Gann line at 1.2941. If it is a 'C' wave, it should thrust and hopefully end in an ending diagonal.
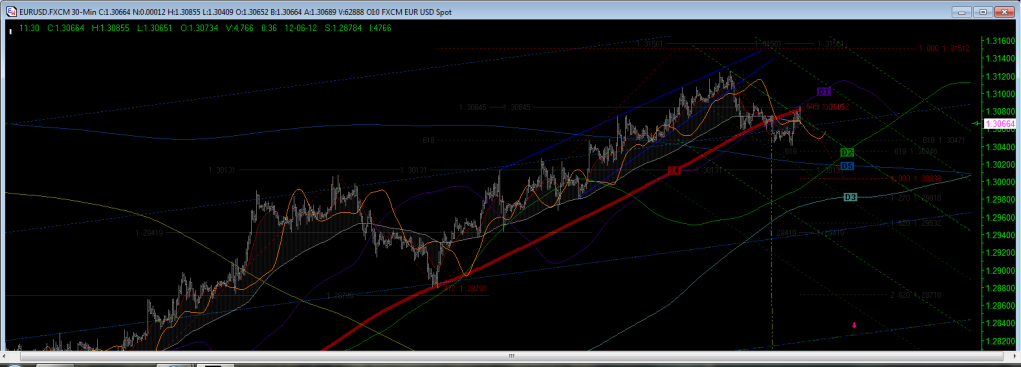
EURUSD: 10.00am
As we approach the Daily pivot - ED on 15 sec chart. Waiting for it roll over and then we may see...

EURUSD: 9.26am
Looking like an expanded flat and right into the green My-Grid line, D1, D1/4 and backtesting T4. All good. Downward ho????? Stop still in tact at the moment.

EURUSD:8.13am
In the 240min chart, we can see how at long last, the D4 trough (topping zone) has started to exert itself on the price action. This dotted line has been drawn in since it was cut on the 23rd November with the initial walk down its slope rejected at 1.2872. If D5 is 'cut' again here so soon, a touch at D4/D6 looks on to me but a retest of that 1.2872 bounce first is probably key, setting up a head and shoulders pattern; a bounce back up to D5 from 1.2872 completing the right shoulder and the move down to D4/D6 following on. All conjecture but hopefully you can see how the 'D' lines help. Remember these babies are created by price action itself; written in the stars if you like. Reading them is another matter, especially when handled by this starry eyed trader!

EURUSD: 7.31am
Stop held last night and price making in roads to the support levels. Firstly, the bigger picture location: bouncing for now off the My-Grid wall,calc'd off the 'A' wave down from all time high at 1.6037. Price has made it under T4 (the trendline I follow), under D1, remains under D1/4 and under the blue My-Grid lines up from 1.2659. As such, D5 is in its sights but as that is at the green My-Grid line down from the 1.3125 high yesterday, a break there should see acceleration down to D2, then maybe D3. There lies an obvious place for consolidation in between all three 'D' lines, where the storyboard going forward will be decided. In the short term, the Daily My-Wave is now fully formed to the downside, providing a useful visual of momentum. Back again at D5.


Wednesday, 5 December 2012
EURUSD: 9.14pm
Stops now at breakeven on this evenings shorts. See last post for summary. Catch up in the morning GMT. Good night all and thank you for dropping by.
EURUSD 7.44pm
Here is the chart to follow up the 5.13pm post. This is very short term at 15sec per bar but shows the count for that 'abc'. I am short with stop above the high there and thus far there is a chance of this regression channel failing on the first attempt. The daily My-Wave on the 1min chart is looking a lot more bearish than this mornings when I suggested it was primed for a stop run - might be worth looking back at that to see how different it looks. So the first pull down this morning has done more than the last week or so to turn this wave over, albeit it has to be considered a retracement move overall at present. Note how the 4hr trend is under both the 20 & 24hr bands and that the rest are all compressed. If price continues to ferret around under the band, the My-Wave will continue to drip downhill, hopefully into that 'C' wave. Widening out the lens a little, we can see the drop has only been retraced 45% at present, so my short maybe premature and I might lose my few pips trying but the last two charts suggest it was worth ago for the reward ratio. A 100% extension of the current drop from the current retracement high, takes price to D5. To get to D5, price has got to stay underneath D1/4 (orange) and cut D1. If price cuts D1, it brings D2 back into the equation. D2 is not too far away from D3, so if D2 does not hold D3 ..... you get my drift I hope. D3 is at 162% of the current drop/retracement measurements and bang on the green My-Grid parallels for the first drop as an 'A' wave. That looks kinda swoopy to me, and why i entered short with the flimsiest of scenarios to support it. But price bounced off T4 and D1 this morning, so a retest there at least me thinks and if it pushes through, it takes out a blue My-Grid line and the next one is down at the Gann line 1.2941. Enough for tonight - I'll do the bigger picture in the morning and hope my short stop has held.


EURUSD: 5.13pm
Enough of longs for me - almost to target but that spike up looks like a 'c' wave to me in motion and want to be ready for next wave downhill. If you measure the likely 'a' wave and 'b' wave of this move up from 1.3059 in time, they were to the minute the same duration. That is only a few minutes away from being a=b=c as well. So looking for confirmation to short.
EURUSD: 3.35pm
Looking for a bounce to 1.3100 area as part of an 'abc' bounce out of the 1.3060 area as discussed this morning. Then will be looking for confirmation of a turn down into a 'C' leg following 'A' this morning. Here is a chart with the new My-Grid of the move down this morning. The daily My-Wave is under pressure now on the short term chart, but a move right to touch the orange D1/4 line and green grid line would be great place to get confirmation to short again.

Technology issues
Looks like the google document facility has changed to something called 'drive'. This might be behind why the charts are all downgraded. I can do it using Photobucket but not as quickly. I am going to have to look at something else to manage posting here in due course. In the interim, I'll have to move to before and after my trading to avoid losing too much time typing. Always something!!
EURUSD: 10.38am
That was a direct hit of that Gann line (calc'd off 1.2659 low). If the daily pivot holds, then perhaps the break out of the ED is a faker (that is with an 'a' not 'u'!)and it takes the 1.3156 gann line first before coming down again. From the last post, it can be seen the Daily My-Wave is still formed uphill. I shorted into the Pivot, banked and now long with stop just under. Hope for the pop and drop, rather than just drop. Tiny risk. If it drop, then wait for retrace.

EURUSD: 10.05am
Not going to be as many charts for now as the upload from google docs is rubbish. Having to use Photobucket and that makes things a little clunky. Anyhow, the daily My-Wave was setting itself up for a stop grab and so it has. Need more price action to see if this is going to turn over now we are out of that diagonal, and in the interim, having to scalp lower highs or vice verser if turns back up. Would still like to see 1.3060 area where D5, D1, T4 and the next My-Grid line sits. A turn up from there might be worth playing long again if the SMI has bottomed out.

EURUSD: 6.46am
The price action since D5 continues to suggest that it wants to go to the D8/D9 conjunction but this diagonal is primed to crumble at anytime me thinks. I have been watching the higher lows and market entrants are buying with tiny stop distances now - that is being very cautious. A bear move would wash this stops away very quickly and with the SMIs continuing to warn of a fall, although a spike out of the top to that 1.3160 gann line area might be seen first. A return to D5 is nearly 100 pips just for a backtest, so no need to worry about anything else at this stage me thinks. (Just checked the charts in this post and they are no uploading cleanly - don't know why?)
Tuesday, 4 December 2012
EURUSD:2.56pm
My-Grid from 1.2659 plus Gann calcs at 5.625 degrees. Have also trimmed the T & D lines to just T4 & D4. Little pink arrows mark out the baseline of the My-Grid. If you look at the journey up, I reckon this should help on the journey down. As soon as we have an 'A' down, I'll map out the descending grid. I have added the Gann calcs down from the assumed top in gold - first line down is 1.3034 and then 1.2963. Will be interesting to see if price bounces off the calcs running up, or the new ones running down.
EURUSD: 9.54am
Just a reminder to myself to keep that 'sick goose' picture in my mind. Continued up is avoiding gravity somewhat and there is such a tidy looking ladder to trip down if the mood so wished. Short term seems to show a change in momentum.
EURUSD 7.37am
Looking for an 'abc' and those 60min SMIs to bottom out. Base of diagonal, S1 and 2.62x assumed wave A would get the job done I reckon. What a buy down there with all those lower highs to hide stops behind, for a crack at that My Grid wall again. An expanded flat would be interesting to watch.
EURUSD: 6.35am
Yesterday saw the first push through D5, having previously pushed through D3 & D4 and D7. The passing of D7 back on the 15th November, brings D8 into the targets for price, but as of yet, the subsequent topping zones of D3,D4, and D6 have not been able to pull this move up from 1.2659 into a decent retracement. D5 is still holding out after yesterday's break and it has to be said that the price action has been decidedly corrective too, burning off some of the 60min SMI without too much pain for the bullish wave. D5 has also built itself a trough which signifies another possible target topping zone ahead and it is increasingly look like price is going to make a run for D8/D9 confluence before pulling back. D5 remains the gateway here. The position at the My-Grid wall is somewhat aggressive to say the least, but will price push on through, shimmy down it for a bit, or fail. Answers on a post card! Price is still above the daily pivot, and given the position above D5, I will be looking for breakouts over the orange D1/4 to go long again or if price manages to tag the daily pivot or maybe lower at T4 (at D1), a higher low down there. The daily to monthly my-wave is still in tact and as proved yesterday, the bears are not getting a look in at all at the moment.
Monday, 3 December 2012
EURUSD 8.47pm
Price is now back at D5 - my really short term My-Waves (1 to 4hours) have rolled over at the crest of the daily wave, right at the ED perimeter too. The question then, is how far the 60min SMI cycle downhill will travel and whether there will be a compounding effect from the 240min cluster and the daily. There is a lot a meat in that wave up to a month in duration and we are at the My-Grid wall calc'd from the initial decline from 1.6037 in 2008. Key moment or just a minor retracement? I hope for the former and keep looking at the golden cup of D4 on this My-Grid up from 1.2041. Come on....
EURUSD: 8.04pm
Hurst's work advises that cycles are additive in that higher order cycles are comprised of all lower order cycles. Deciding which length cycles to use however is key and then if you are using various lengths, what factors are used to determine which ones are combined. Hurst lays out time frames from 18years downwards and I am running a study for this on the daily chart that I post from time to time. However, the works of Goodman, Fibonacci, Donchian, Andrews, etc, etc pretty much centre around the ongoing retracement of price to 50% of its expansion at any given point in time. Looking backwards, it would therefore follow that price had previously expanded to double its future retracement. Many price envelope style studies (whether Keltner, Bollinger, Donchian, regression studies) focus on the volatility or range around a median and that median having at times a magnetic quality. It is this tendency that provides many a trader with the hope that their study is the one. The key to all of this work however, is the choice of cycle length being used to trade, be it daily, weekly, monthly or whatever and the way in which that cycle is portrayed (which MA version or otherwise and what settings to use). Hurst's work suggests trial and error to find the dominant cycle using shifted moving averages and it would seem that recent developments in technical analysis can find the dominant cycle for you rather than eyeballing the charts. However, in my work, I have found that the dominant cycle shifts relentlessly, expanding and retracting in length, sometimes with momentum, sometimes not! I have therefore focused on working on a periodic 'ladder' beginning with a lower order cycle length and then building outwards with the same expansion ratio throughout. In this way, the gaps between the cycles lines are pre-determined and provide exact targets in time and price. These are my 'T' lines. It is also then possible to track the likely future journey towards these trend targets by monitoring the cycles' 'waves' over their lifetime (their rise and fall) and all their lower order cycles. As I said at the beginning, cycles are additive, so if T7 is leading the show as it has been, monitoring what the future cycles D1 to D7 are doing will help to pre-determine the journey T7 is taking. Nothing is perfect but I keep trying!
EURUSD 4.57pm
Looks like the 4th in the 5th there or first leg down. I might get my correction yet! SMIs still supportive of deep pull back to test 1.2659 low but anything is better than this ED. Just how hard will the goose be sick? I have been waiting over a week now for my 'D' lines to provide a ladder down to D4/D6 at the bottom of the chart, if only to prove to myself, that they have merit, just as d5 did as a target on the 23rd when we D4 was 'cut'.
EURUSD: 4.30pm
Well, as we were me thinks. Price has made it over the D5 line again but all overlappy, chop chop, signals ending pattern of some sort. Feeling a bit seasick but contracting diagonal or expanding diagonal perhaps, although not as neat as the former. Obvious ledge there above D1/4 - waiting to short again.
EURUSD: 1.20pm
Looks like D5 break up is holding so far. I have nudged my targets up to 1.3250 in case of rockets going off. If D5 breaks back under again then short I am. Recall from the weekend report, we are north of the yearly My-Wave spine here and that blessed trend line from 2010 that held things up all last week. My next 'D' line up is that D8/D9 conjunction at the 61.8% retracement of the move down from 1.4939 to 1.2041. The nearest Gann line to there is the 1.3307 marker which is right at the next My-Grid line up from 1.2041 too. There is the 61.8% extension of the move from 1.2041 to 1.3171 at 1.3366 and into the next My-Grid box I presented over the weekend, so maybe 1.3250 is too low. I'll be taking it off the table anyhow and waiting for a retrace for sure!
EURUSD : 12.57pm
D5 taking a strike - if it can not be recaptured, I'll be targeting the next Gann line up at 1.3164.
EURUSD: 9.56am
Well that is D5 hit exactly. We 'cut' D4 back on the 23rd and by hook or crook, we got there. D4 and D6 are the next sequential numbers to D5. Or alternatively, a push on to D7. But.......all of them are way below this price range. See 240min chart for birds eye view. Looking for lower high to short this now but wary of that My-Wave in the first chart. The alternative is a jump to D8, but I still prefer the pull back first rather than later. If you have not read this weekend's Lines in the Sky, might be worth a review are where we are right now.
EURUSD 6.24am
Longs closed out and now out of market. Price has got right up to D5 (recall this is a median line and some leaway on proximity has to be given for touches)and the SMI clusters on both the 60min and 240min look toppy. No matter that price may continue, I will relook for entries near that last low last night to go long again, but generally wait for the SMIs to soften. I'll only short, if on a retrace, the daily My-Wave remains turned down, which it is not at the moment.
Sunday, 2 December 2012
EURUSD: Lines in the Sky Report
Here is the Lines in the Sky report for the EURUSD for the 2nd December 2012. The navigation link will be updated for later reference. Please take the time to let me know what you think of the report and how you might be using it. If you do find it of use, please let others know that this blog is here. It is free!
Saturday, 1 December 2012
Reading list update
I have updated the 'Clivewaverider reading list' in the 'useful references' section. Still not finished and maybe it will never be, but a little bit more complete than it was.
Subscribe to:
Posts (Atom)