Monday, 19 November 2012
EURUSD 9.27pm
With everything else done tonight, price has moved back up again. Fading in, in small increments, shorts from 1.2813 - SMI's tired and T4 way down and flat still at 1.2680. There is slight upward movement but I am playing for a return of some sort part of the way to bide time.

Photographs: Meet Dexter
A mixed weekend of hill walking, weather wise, but what a treat if you like the animal life! This was my first sighting of a Harlequin Standard Poodle, by the name of Dexter. A real treat for me as our Gracie, the Curly Coated Retriever, is part Poodle, Irish Water Spaniel and Retriever. Having had the IWS, got the CCR, the missing part of the picture was before me. What a beauty. Meet Dexter (2)


Weight Management Diary
The Weight Management Diary has been updated as of 19th November 2012. It has been a difficult month with the back falling apart again, but still managed to move ahead. Just refer to the quick navigation links on the left to catch up on my progress and perhaps more importantly, the very simple way of getting matters under control!
EURUSD 4.20pm
Shorts closed for a few more pips in the bank. That is it for me today. Will have a look at matters first thing in the morning and see what time has done to provide a safer entry either way. This is the crux of the matter and well established in such films as Kung Fu Panda: there is no secret....there is no secret.....there is no secret well apart from the fact that you need to know there is no secret, which is perhaps a secret in itself. So what am I saying? Well, if I think and feel that the market has zoomed away from my comfort zone and I don't know whether to stay in, add, bank, where to move the stop to, etc, well I think that the market doesn't know either. This is where the work of Goodman, Hurst, Fibonacci, Elliott, Donchian, etc, comes in to play; the patterns that play out in the market are a natural human resolution to figuring out where everyone feels comfortable; the equilibrium point. So start listening to yourself and you start hearing something. Lesson over; must learn that for myself!!
EURUSD 3.53pm
Have sold this for a tiddler. T4 still encamped at bottom of chart - more retracements coming me thinks! Will top up if price drops under D1/4 and gives a 'b' wave to short.
EURUSD: 3.33pm
I have closed longs here: the SMI cluster is showing negative divergence and we are back at that grid wall of mine. I think I would like to re-enter long when the SMIs are back at the bottom of the range and bank my well earned monies here for today. In the back of my mind is the US holiday week in play and possibility of a lack of momentum. Perfect for me would be for price to lay back down D7. So out of market for now and hope for a pull back so I can draw a trend line over an 'abc' pattern.
EURUSD Stops
Stop is under the last low there at 1.2749 - counting a 1-2, 1-2 up from 1.2689 on Friday. If it takes my stop, I'll wait until that trendline into a 'D' line pops, but so far just been topping up here with better risk reward - in fact tiny compared to the possible outcome if D7 rejects uphill! T4 really needs to start turning up to get the market rolling and maybe we go down again to tease it up.
EURUSD : Bigger picture
Another chart from the weekend report: searching for a target using the 85.4% fibonacci fan. Details in the report of how to do this and why. Here is the 'Hurst' study I am running regarding timing and looking at the 11th December now as the next top of acceleration point. See how the previous dates lined up exactly.
EURUSD 11.24am
Another tiresome waiting game but no problem if direction is the right way! Note how D1 is now the one providing resistance, not D3 - this is all happening above D7 - keep this in mind!! Break of that trend line will then have to be retested of course, so sleepwalking up here but the regression channels look hot and potent. Lots of stops to be taken out above 1.2801 - maybe 1.2878 is a little low a target for today? umm.
EURUSD 9.56am
Short term picture making my weekend report 'Lines in the Sky' worth referring to - see quick navigation link to left of screen. Here are the short term lines following the script so far. I am looking for that move to D4 now, which is higher than my 1.2878 initial target, but this latter line should provide a consolidation zone first.
EURUSD: 9.46am
D7 took a punch and now being retested - quick reminder of why this is such a key line in the sky. See weekend report for detailed explanation.
EURUSD:8.25am
Target today will be the daily pivot R3 sitting just above the next gann line calc' in the 1.2878 area, assuming D3 holds of course. All I need to do is stay on the right side of D1/4 and the daily pivot!
EURUSD: 7.47am
Feeling a bit 'Monday morning' myself today but a good walk with the Jack Russell should clear out the cobwebs. Amazing what a day off does! Quick chart this morning shows D3 finally breached making D4 the next target if D3 can hold. Price is right on D7 as I write. This is a key moment in my ongoing thesis.
Sunday, 18 November 2012
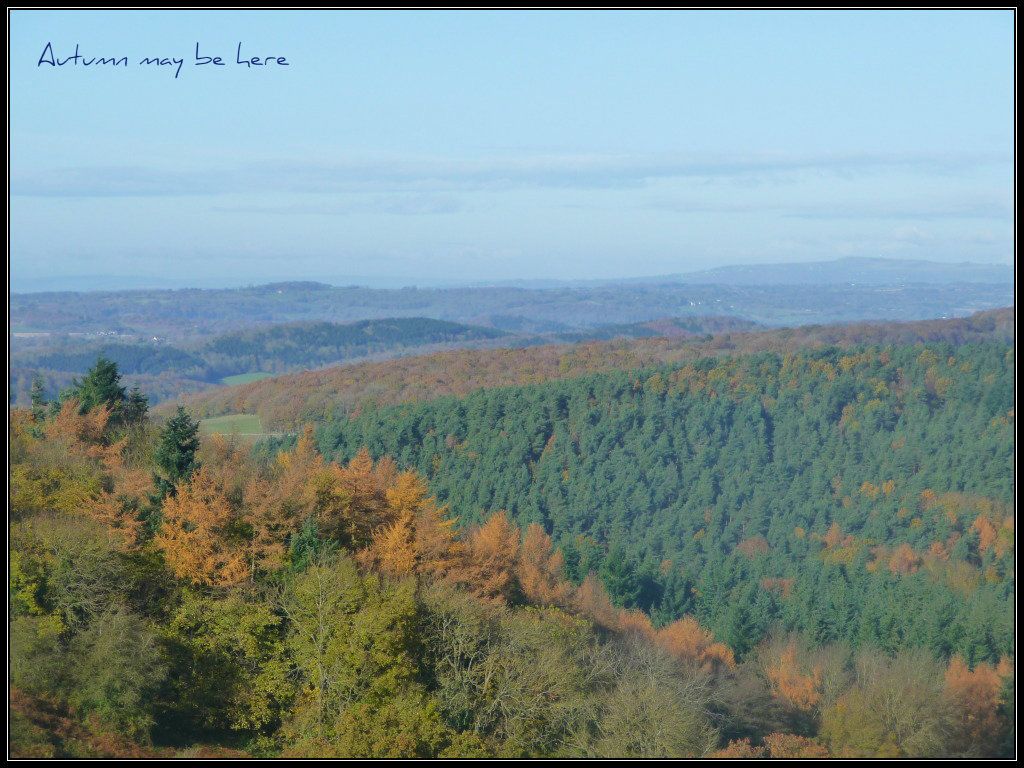
Photograph: Autumn may be here
It really does seem that Winter is trying to get here before Autumn, which is somewhat concerning as winters in Malvern can be somewhat tiresome after the initial enthusiasm for less grass cutting, wanes. I had been on the look out for an Autumnal scene and I think this one cuts the mustard from West Malvern. Photograph: Autumn may be here
Saturday, 17 November 2012
Lines in the Sky report posted
The 'Lines in the Sky' report for 17th November 2012 has just been posted in the quick navigation link on the left of the screen. I have changed the format slightly so that earlier versions are available too. I do not know how many is enough but probably a rolling 3 months in due course should suffice. The format is starting to become more stable now, so hopefully I'll add another asset class in due course. I do quite fancy taking on copper!
Friday, 16 November 2012
EURUSD: 9.32pm
Yes it did! T4 was collected safely and D2 held firm (D2 is the next natural target mathematically after D1 failed in a retracement and I do not know which will hold in advance, notwithstanding guesses/counts) and now we are back up to D1, with D3 a little bit closer in time than before. I think Sunday night sees a gap up or thrust up through D3 towards D4, but I'll write everything up over the weekend. Very exciting week for me, watching these 'Lines in the Sky' come together. I am absolutely not harnessing all the monetary power they are offering, but I am definitely moving in the right direction, albeit my wind and sail!!
EURUSD: 3.52pm
T4 now collected. D1 did not hold and we got what could still be an extension in Wave 2 down. D2, so far has held. Will it now go up?
EURUSD: big picture
The turning points of my 'Hurst Interpretation' chart have been quite startling to me. I do not bring this out too much, cause it is my own work based on my own cycle calcs/indicators, not using spectral, fourier transform etc. Basically, it is a visual interpretation and subject to all sorts of 'tutting'. However, it seems to be working. Given the next turn date of the 11th December, the two '3 wave legs' since 1.2041 and me thinks it is worth a guess at this formation. We shall see.
EURUSD: 12.47pm
Looks like D1 has held at the Gann line as hoped for. Have drawn in possible course of next wave up, cutting D3, bouncing off the back of D1 again, before moving on up towards D4. SMI seems to be helping us here as these only support directly in retracements.
EURUSD: 9.51am
Okay, last charts for a bit. Reckon there might not be much time to do more if price zooms off to the upside. Recall, if D3 is cleared, D4 becomes the next target. 1.62x the current set up for a wave 1 & 2, puts price right at D4. Looking forward to a great end to the week.
EURUSD: 9.39am
Just a quick look at why D7 is so important - that is, if yesterday's high is cleared. I think the chart says it all. If you want to know more, just ask.
EURUSD: 9.25am
Grid and gann lines working well here in creating target areas. A break of yesterdays high should see price embedded in the next section up with 1.2878 as target line.
EURUSD: 9.21am
Looking for D1 to provide support here - it is also the 127% extension of last nights 'A-B', and the SMI seems to support the move - D3 still the target. Got my eye on that D2 topping zone marked out by the green dotted line. A rise into there would clear D3 and then maybe a deeper pull back to pick up T4 from earlier post. Just musing...market will tell us.
EURUSD: 8.26am
Faded in here - approaching 1.2736 gann line, SMI looking like right area for a retracement and the move to downside thus far, looks 'abc'. Could be more downside but moving in long from here.
EURUSD: 6.53am
Well, I am glad I reversed from longs to shorts last night! I am looking at the charts and I could post ten at least, all with key areas being tested but none broken. It is a Friday and it has been a long week, so I am going to avoid the big summary this morning and save that for the 'Lines in the Sky' report over the weekend. I'll keep it simple: I am now looking to go long, as close to T4 as possible. A new high will take out all the areas I covered in detail yesterday, so perhaps go back to those charts if you'd like to recap. Trading day, here I come!
Thursday, 15 November 2012
EURUSD: 8.28pm
Shorts closed again here. Closing down for tonight and reassess with fresh eyes in the morning. Good night all.
EURUSD: 5.09pm
Or is it an expanding wedge? Looks like might work better if it reached the lower perimeter, as wave 4 back here inside the wedge would encroach on wave 1. Getting ready to short gain somewhere in here.
EURUSD: 4.58pm
Shorts closed; if ending diagonal playing out, we got some place higher to short again. Worth the waiting this!
EURUSD: 3.55pm
Shorting this puppy now; nothing too big, just T4 so far away, can count 5 waves up, there is negative divergence on the SMI bundle, weekly My-Wave is till formed to the downside, top of regression channel, etc. Lets see if can pick up an abc back down again.
EURUSD 3.09pm
Well, that is me out for now. Close enough to D3 for me to count that as another tick in the 'methodology works' box! I am a bit buzzy with adrenalin at the moment so, I'll post this chart to mark the transaction and come back later. D7 has got punctured here - this is a key moment and I want to stand back and watch rather than be befuddled with a trade. Recall T4 is way down at 1.2700 ish, so I would love another chance to buy this lower.
EURUSD 10.13am
T7 & D7 sit in the 1.2780-1.2790 area and that 1.2803 low (being the first drive low off 1.3171)is just above. D3 (our initial target) is higher at 1.2830 with the 2.62x extension of the first drive up from 1.2659, slightly higher at 1.2849. If we get there, the weekly My-wave will have been cleared, albeit retesting is probably on the cards after that. So D3 is the target today and then wait for a recamp and for T4 to join the party. See previous posts to locate the above.
EURUSD 9.46am
Price is moving along. D2 seems to have been tested enough but who really knows? Will be happier when D3 tagged, especially as it provides ongoing credence to my 'Lines in the Sky' methodology. I have drawn in an ongoing regression channel off the low and reckon the path to D4 looks clean - this is the displaced brother of T4 which has been leading the charge and is mathematically tidy in time and price to get back to D4. Recall, D4 & D5 are providing 'bottoming' tension
EURUSD:7.18am
A quick review of the various My-Waves to help locate what is going on. No need for commentary here as self explanatory. I generally do not hold with 'the trend is your friend' unless it is; more accurate is 'the trend tells you where the journey has been so far, now it is up to you to decide if it will continue'!
Daily My-Wave /
Weekly My-Wave /
Monthly My-Wave
EURUSD 6.34am
D2 has held overnight with price using that D1 trough as suspected to consolidate its position. Also the 1.2736 Gann line held too. D3 is looking like it may well get pushed for today, but unless price action takes on a more aggressive stance, that might be a place to look for reversals downhill, whether corrective or not. Looks like the market does not trust this move uphill at present and nor do I tell the truth!
EURUSD: 6.23am
Not a lot to add to last night. Price action looks corrective but I am hoping it will turn out to be something a bit more sustainable than it looks. Price is still above the T4 trend line and the Daily My-Wave is turned up - not a shorting exercise by definition for me. Looks like this could turn out to be a 4th wave in the 'C' wave down from 1.3171, but nothing clear. I have drawn in 85.4% fibfans off the first strike up off the low (deleted the standard deviation channels as was doing no good here)and now the last high - just to see if we get some traction somewhere. If this does turn up again, then a break of the brown 'A-B' line might help after the daily pivot touch, and the back of the first 85.4% fibfan (top one) may be the target, eventually. Grasping at straws this morning with this dribble but following the DMW & T4.
Wednesday, 14 November 2012
EURUSD 10.30pm
Can not ignore those stock market drops! Having said that the EURUSD still seems to be making an upward stab and where it will get to, is my concern, not its correlation with equities. Price action seemed to pop out of a triangle earlier today and fall back in what should be a correction, as that looked like 5 waves up. As such, D2 has still not been cleared convincingly, using the D1 trough already to consolidate, nor the grid perimeters & Gann calc line at 1.2736. Price had approached the 1.2803 low of the first leg down from 1.3171, also T7, and got sold off quite abruptly but thus far without follow through. Key here is the removal of the option of a 5th wave down (if 3 is actually complete) and confirmation that we are going up again. We could of course still get another leg down in the proposed 'C' wave which would need a higher break past 1.2878 to outwit. It is no surprise perhaps that D7 is still in play too and the main plank of my 'another leg up thesis' is the beating of this and a move back to D9. So, in the interim, I am going with the simplest explanation and that is we are waiting for T4 to turn up with price and the daily My-Wave are above T4 and in an upward formation (for now!)
Apologies
I think I might have had the incorrect url address for this weekend's 'Lines in the Sky'. Have just updated it to make it a public access link. Do let me know if you have any problems.
EURUSD: 2.00pm
Price still wrangling with D2 & the Gann line but burning off that overbought SMI cluster in the meantime. Daily My-Wave is still intact to the upside and looking like running triangle being built here or something similar. Would appear price is waiting for T4 to turn up but may need that move to 1.2878 to secure the deal. There is going to be a pull back to T4 at some point higher up, so I'll bank longs up there somewhere near 1.2878 and wait for retrace.
EURUSD: 10.00am
Update of the standard deviation channel I drew off the 85.4% fibfan yesterday (of the initial drive up) - I had to draw in -1 & -2 too with that retracement, which will put the fib fan in the centre now as opposed to the right side/underneath. A push above the centre line and holding it will be interesting to see, I think
EURUSD 9.44am
D2 has now been reached along with that Gann line as discussed yesterday. If D2 is breached, D3 is the target. I have drawn in a potential topping line being created by D1 at the moment but I would wait to see what happens at D3. I see the next Gann line at 1.2878 and if price pushes up through D3, it will use this D1 topping zone to lay gently over the back of D3 before pushing onto D4. A push through D2 will create a future topping zone for that too, so need to keep an eye on this next part of the move. If we get a thrust, it is likely a '3' in the wave so we should be able to count 4 and 5 for wave 1 or A up. Catch up later.
EURUSD 7.00am
T4 has been broken to the upside and the Daily My-wave has turned too. Yet there remains some work to be done here. After that ending diagonal and the time spent driving down into it, one might expect something a tad more convincing and some follow through would be welcome! We are sat underneath the Gann line of 1.2736 and a grid line off the 85.4% fibfan off 1.2041. This area has been tested already a few times on the way down, so a break there should seal the fate. We are however, above and holding D1 so D2 should at least get a touch. That sits at the Gann line, so a break of both should catch a wind to D3 or more. The last chart this morning shows where T5 sits in relation to that 1.2878 gann line - on the way and past the 1.2082 marker which sets out the bottom of the first move down from 1.3171. If this is passed, then the wave 4 down is knocked off the list!
Tuesday, 13 November 2012
EURUSD: 2.24pm
Well, we certainly got a retracement of that spike up! Whilst the low holds however, I am going to assume the market is trying to scare the longs out of their positions and I am using the 85.4% fibfan line of the 'low to spike high' to create a channel, two deviations deep. The 2.168x extension at 1.2828 for wave 3, looks like a good target to me. We shall see.
EURUSD: 12.07pm
Price has pushed cleanly through the daily My-Wave but first stage is for that My-Wave to turn over; so expect some consolidation at that point, although it could be a flattish wave 2 in this first move up, given the pent up demand in the ending diagonal. In Bayer's 'Egg of Columbus' he describes the ED as both 'tongue' and Hors d'oeuvres, as the beginnings of the new cycle are to be found in the entrails of the old and the market needs to separate out the two before moving along. We are already at D1, but with D2 so close, I am looking for that also to be breached and to hold; this should ensure a move to D3 at the least for the next course. The red dash to the left is that amount of the ED I forgo to be ready for this punch; the other lost asset was of course time which bothers me more! Moving up to the next Gann line at 1.2878 (which is where D3 sits)would not only bring into play T5, but also the possible 'A-B' trend of this C wave, with D5 sitting higher at the A-B line of the whole correction from 1.3171. Let us see what the market makes of it!
EURUSD: 11.43pm
Well, it looks like the waiting is over! For all the readers who are as impatient as I am, it is a tough job this but the belated joy of catching another wave is all we have! Catch up later.
Photograph: Getting along
Jackie, the Jack Russell, is over 10 years old now and taken a little time to warm to Gracie. They are at least sleeping together at night which is keeping the puppy quiet for a bit! Gracie has already doubled in size in 2 weeks and will undoubtedly star in many Malvern wildlife photographs in the years to come, just as our beloved Irish Water Spaniel, Reilly, has done in the past (and will continue to do so for as long as the backlog of photos keeps on providing!). Photograph: Getting along

Photograph: Toadstools
That muddy lane surely delivered at the weekend: a hawk of some description and these toadstools. Accepted, not very exciting compared to the Hawk but next to that muddy lane, a delight, albeit not edible me thinks!

EURUSD: 9.20am
So, I have had to have the patience of a saint I reckon, although watching my new puppy Gracie (curly coated retriever) get bigger by the minute, has kept me sort of sane. To recap, I did not want to get involved in shorting the latter parts of the ending diagonal because my bigger picture analysis is that this is the ending pattern of a C wave in a corrective pattern off 1.3171. As such, the thrust out of this mire should take the breath away in comparison to trying to catch shorts for a profit. So, I wait for that break out. The daily chart attached here shows the green regression channel of this whole move down from 1.3171. I have assumed the 'A-B of C' count and posted the 61.8% to 162% extensions of the A wave. As discussed last week, I think the D8/D9 confluence is a key decision point and hope for a 'A' leg to there to begin with. This coincides with the yearly displaced cycle that I posted in the weekend report.
EURUSD 6.35am
Ending diagonal appears to be complete with 5 waves inside the perimeter walls, having reached the 127% extension of the first wave down from 1.3171. Looking for that punch out now and a quick move to D3 to get the next leg up going. We have had 3 legs down from 1.3171, so for now the wave 4 of A or the B wave of ABC up from 1.2041 are still on, although I tend to the latter. However, if we get a consolidation pattern instead of an impulse that takes out 1.3171, well maybe we have wave 4 down of 5. Best keep the options open until the market knock them off the list - my days of doing that for the market are well and truely over!
Monday, 12 November 2012
EURUSD 5.40pm
Not a lot to add to the weekend report but thought I'd throw in the Gann calcs off 1.2041 (11 degrees). We are obviously fighting the slowing momentum of the downward diagonal with the overhead cover of the Gann line 1.2736 which has so far been defended. However, T4 is looking very tired if the 4hr &16hr MACDs have anything to say and a return to T5 at the next Gann line up at 1.2878 (also near todays' R3) looks on sometime soon. The weekend report explains how both T4 & T5 are in bottoming formations in respect of their displaced cousins, but fighting the topping power of D6 and sliding down the underside of D7(see report) - however, see where its cousin T6 sits in the first chart! Some gap now opened up and some return would be healthy me thinks and T5 is a good start, mathematically. Look also where T7 & D7 would be if T5 got tagged - yep under the price action and just in case anyone forgot, T7 is rising!!!
Not concerned at any drop as I am not following it, just the break up when it comes.
Saturday, 10 November 2012
Photograph: Hawk
This morning I posted a photograph of the muddy lane I faced taking the dog for a walk and expected nothing more. However, the extent of the fog and mist had a hawk of some sort (Sparrow Hawk?) hunting in the hills around me and perhaps suffering from a lack of sight in the gloom - hence it did not fly off when I tracked it with my rather simple digital camera (click and go!). Anyhow, this is my reward for taking the camera out today. Photograph: Hawk.

EURUSD: Lines in the Sky 10th October 2012
The bi-weekly report 'Lines in the Sky' has just been posted.
Photograph: A little muddy
I was somewhat resigned to the damp conditions today and this trail was a good example of what I was expecting. Photograph: A little muddy. However, there were a couple of opportunities for something worthwhile along the way and I'll post these over the next couple of days.

Friday, 9 November 2012
EURUSD 2.00pm
I feel like I have been charting this diagonal all week but not so, only really since yesterday morning. A poke out of the bottom of lower perimeter can offer great risk/rewards and I am now looking for a strong move up. We have been traversing the 'topping' forecast of D6 since 1.3171 and now we have both D4 & D5 asking for bottoming action. Combined with the ending diagonal, the 'C' count of an 'abc' since 1.3171 and the positive divergence, and I have no reason yet to doubt up is coming. First line in the sand however is T4 and D1/D2. Tired of waiting!
EURUSD: 11.10am
Got to see this move down as another leg in the Ending Diagonal of the C wave down from 1.3171. I have tightened up the perimeters and keep staring at the positive divergences across the charts. T1 has made it above T3 now, notwithstanding the move down in prices, so momentum and trend are changing beneath the sheets. Look out for a stab upwards to D1/D2 and if it makes it across to D3.
EURUSD 8.48am
We have had a move up early this morning into the vicinity of T4 as high as 1.2789. It has so far been rejected, but this arrow like formation looks and feels like a 'b' wave - a faker. If this is a 'b' wave, that would make yesterday's sidewards action a possible 'b' in an 'abc' up for the 'a' wave. It would then follow that we have a 'c' wave to come that should take on a more familiar feel. The depth of this pull back suggests that the ending diagonal structure could be the prime target, so I am still looking for a touch at D1/D2. It is noticeable in the first chart that T2 has now made it above T3 (that is the shorter time frame is above a longer one) but T1 has yet to skip across both. This pull back may be acting as a collection trip before moving back up to T4. On the weekly My-Wave we can see how price launched itself out of the downward channel and is back-testing the perimeter right now. There are a number of options going forward but for now, T4 has got to be surmounted if anything other than more of the ending diagonal is to come. Alternatively, price continues to drive down and provide confirmation of a more bearish structure overall.
Thursday, 8 November 2012
EURUSD: 4.50pm
Oh, it has been a slow day. But therein lies some of the answer as I have been working on this being a turning zone and so far it seems to be so. If we zoom out on the My-Wave, there is a clear 5 waves down with that familiar Elliot Wave formation about it. We have also got positive divergences on the MACD which usually accompany 5th waves. Zooming in again, and My-Wave has yet to turn up but is obviously under a lot of pressure here. Part of the push and shove I think was caused by dropping under the 1.2742 level, being the 38.2% retracement of 1.2041 to 1.3171, and bringing the 127% extension at 1.2672 into play - a sort of, shall we or shan't we.... Anyhow, we seem to rolling along the bottom of some formation but may just be a trend line, but could still be a ledge to further downside. I am however, looking at the D1/D2 intersection at 1.2815 ish as the decision point, which is where T4 sits (see the My-Wave charts). A clean slice through here would bring D3 into play which sits at the 85.4% fib fan line of this whole move down (green dashed line) from 1.3138. On this final chart, I have marked up an 'abc' for this whole move from 1.3171. I can not see a clear 'third wave' in there at all, and have to run with this either being a 4th wave in the move up from 1.2041 or a 'B' wave. Some clarity will hopefully come from this next move up, but clearing D7 will have to come first!
EURUSD 10.10am
Price pushed down from D1 - I am looking to add to my longs as I count this as a 5th wave down and a potential expanding diagonal or contracting; a small ending diagonal here would be peachy, especially with T1 still above T2 and positive divergence on the 60min & 240min MACDs. This is the Weekly My-Wave and we are nearing the bottom of the regression channel from the 1.3138 top; a good place to be hunting for longs me thinks. In addition, according to my cycles analysis, we are nearing a potential 40day and 80 day bottom on the 13th November. Nothing is ever guaranteed but probabilities for a reversal are adding up in my eyes.
EURUSD: 7.40am
D1 has continued to hold price action in a consolidation phase. Impulse moves follow consolidation moves, so in simple terms, all we are waiting for is the train to leave the station. The extent of the prior moves and the positive divergence on the MACD's suggest up is next, but it is only a suggestion as the market will go where it wants to and the counts will fall in line. My 'long' tiddler from yesterday is still a tiddler and I wait for a series of higher lows that sticks to get trading. My-Wave is still formed to the downside but with T2 still below T1 (bullish) I still think we might get a stab up. As T4 has been leading this charge down of late, price will need to take out yesterday's high to convince everyone of the bullish case or at least have a go, but for now, the bearish one has stopped at that 38.2% retracement line from the 1.2041 to 1.3171 wave and T7 as covered yesterday, so the market is taking a good hard look here. Whatever the outcome, it is a significant zone for later!
Wednesday, 7 November 2012
EURUSD 6.11pm
Well, that looks like a consolidation pattern to me and not quite the triangle it started out trying to be. It has yet to divulge its hand but this move is pulling price above D1 from the earlier charts. I am looking to go long here and although I have a tiddler on the hook already, I am looking for a strike for home to appear. Let us see if it comes. Any move lower and I'll assume that is a 5th wave down and I'll be looking for a small ending diagonal to fade.
EURUSD: 2.46pm
Looking like the 'expanding flat 4th wave up then 5th wave down with positive divergence down' from yesterday's posts looks on; we got that divergence at the moment on the 60min and 240min charts. Looking to go long on confirmation above D1. Worth a few pips risk here as reward could be high with a possible 5th wave up. Possible entry on breakout above the short term triangle or on break out of the bottom then reversal pattern. Catch up later.
EURUSD: 12.53pm
Been a good run this for me. These 'lines in the sky' are extraordinary in my opinion but it is only since I stopped trying to be led by the potential Elliot Wave counts that life as a currency trader has got easier somewhat. In simple terms, I am trading the picture as it is being drawn, not trying too hard to figure out what the picture is finally going to be. We hit the 38.2% retracement line of the 1.2041 to 1.3171 as anticipated and in doing so D1 has been penetrated, discussed earlier. there is a lot of room in the MACD's to keep going down and the My-Wave has not even turned down yet. I have closed all trades at this juncture and will wait now to see what happens. The market has to make a decision on what count it wants to go for and I can only follow. Breaching that D1 trough needs clarifying, so I am looking for a consolidation pattern to catch my breath.
EURUSD 11.35am
These are the trend lines driving those 'D' lines in the previous post, up to D7. Given My-Wave has yet to turn over yet to the downside and how much pip mileage has already travelled, I wonder with the current failure of D7, whether T7 (at the 38.2% retracement mark of 1.3171 to 1.2041) is about to cave in. The 4hr & 16hr MACD's are in the right position and see how T4 continues to drive the 'stack' downhill - all is in alignment above - just T7 in the way. Will it hold or not?
EURUSD:11.15am
Well, as suggested, price fell from T4 and has retested that level this morning, on its way to the D1 trough. However, price action is looking a little aggressive at the moment, so I have been looking at the bigger picture for clues as to what might be occurring if that trough does not hold. Here is a chart of higher timescale 'lines in the sky'. Look at how D7 is repelling price action at the moment and where D6 currently sits. Now look at the next timescale up and see where D7 sits in amongst the journey and how it just maybe taking over from D9, which has been a long term partner. Alternatively D7 breaks to the upside and we return to D9. Lots of options huh! All I can do is follow D1 though and see where she takes me.
EURUSD 8.09am
Quick one here with the school run but given everything has gone according to yesterday's write ups, perhaps refer back in the interim:
Chart1
Chart2
Chart3
Key now is the move into the purple D1 trough. I reckon we just saw the completion of a 'c' wave in an expanded flat wave 4, but the location going into D1 suggests that we either get a shallow 5th wave for a marginal new low at 1.2742 or a 'b' wave to drag the correction out longer. Wave action is our key.
Tuesday, 6 November 2012
EURUSD 7.42pm
Well, just like magic, price has made it to the Purple D1 line and is also where the T3 trend line sits. The 60min SMI is oversold at present but no immediate reaction downhill. If price falls away on the underside of the purple D1 without making it across, then I'll start shorting the lower highs when the My-wave turns down again. If price makes it across, then we will still see a retracement downhill in due course, but this is likely to be held in the purple trough and I'll be looking for the My-Wave to hold too and the SMI to bottom out, then looking for higher lows to buy.
EURUSD: 3.45pm
My-Wave has almost turned over to the upside. I have added the trendlines I use (T1-T4, shortest to longest respectively) and as can be seen, this quiet period has not been so quiet under the surface. Still looking for price to make it to Purple D1 to gauge what next. This price action does look corrective or a leading diagonal but either way, we hit the 2month tide zone and now going back to check the weekly commitment to continue further downhill or not. MACD's on the charts look primed to me, but may fall away in a 5th wave down, if that is what is on the cards.
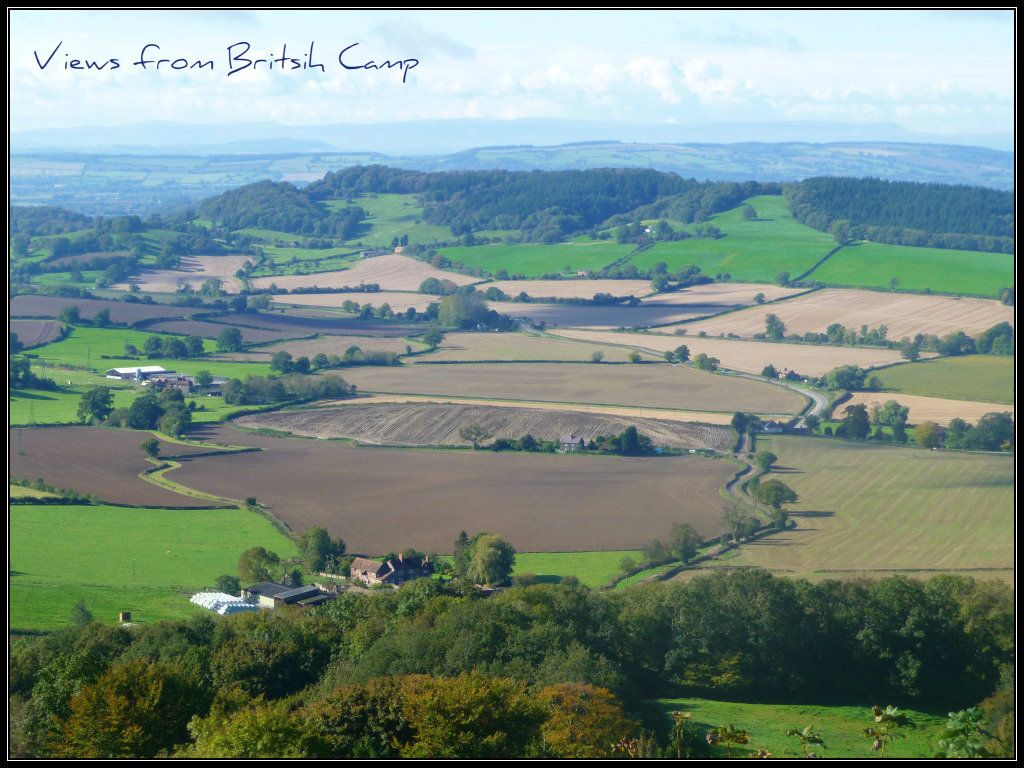
Photograph: Views from British Camp
It is a fact that on sunny/clear days, the views across to Wales from British camp are not as clear as somewhat wetter conditions. I am not a weatherman but there you have it. Here are views across from British Camp on a mediocre day up top and not bad at all.
EURUSD: bigger picture
Here is my daily chart showing all off the median 'tides' over longer time frames. See how the 3m and 6m are following up behind the 2month in a very clean stack, butting up against the yearly tide. A move to the monthly tide again would push price above that yearly tide line! From my bi-weekly summary 'Lines in the Sky', I had been working on that initial move up from 1.2041 being an 'A' wave as being part of an 'ABC' to make up the 'e' leg of the triangle from the 2008 high, to complete 'B'. We would then have a substantial decline down into the parity level with the US$. This 'A' leg either completed at 1.3171 and this is the 'B' leg of that ABC=e wave, or we are completing wave 4 of that A leg and moving into the 5th wave. There are other counts of course, including the '1-2, 1-2' count in the big 'C' leg already, but I have not been comfortable with that for a whole year given the incessant chop chop.
EURUSD 10am
Looking at the 240min chart then, we see price has been held thus far above the 38.2% retracement of the 1.2041 to 1.3171 wave up, sitting on top of the 2month 'tide'. We have however completed a 100% extension of the initial move off 1.3171, so maybe the 'abc' B wave is the formation and is complete. We have certainly got some upward reaction going on right now, as I had been looking for, so we will have to see how matters move along from here. I am looking at the 4hr MACD's interaction with the 16hr and their zero-lines as price moves up here. We are firmly bedded in the bolly bands at present and the weekly 'tide' looks very aggressive. Note however, that the monthly does not. So is the weekly still leading, or is it going to get beaten back at least to the top of the bolly band to pick up the monthly tide?
The purple trend line (T) moved sidewards and has acted as support for price action overnight/this morning but that 60min MACD is still in the sell zone without a zero-line check back in the bag. Got to bear that expanded flat maneuver in mind as we go along here. Again, the purple 16 line is the initial target zone as I covered yesterday. How price interacts with this will be key. If price moves through it rather than slide off its underside, then that green 32/blue 64 cluster looks attractive to the right.
My-Wave is now under pressure as suggested earlier and now we shall see what the market has up its sleeve.
EURUSD: 9am
Very slow action is usually a sign of either a 4th wave or a B wave in Elliot Wave terminology at some degree of count. Given the move down this morning is also overlapping and stodgy to say the least (out of what I thought was a 4th wave triangle yesterday) it is possible that we are in an expanded flat retracement for the 4th wave where the 'b' leg makes a marginal new low but then pops up with what looks like a trend reversal, only to reverse again down in a 5th. A possible confirmation of this is the MACD on this 60min chart which has yet to reach the zeroline, which is usually where the 4th wave ends, prior to a new price low with positive divergence on the MACD. Alternatively. we are in an expanding diagonal as a 5th wave, which would also see a jump up in due course.
So, still looking for a pop up with the purple 16 line in the sky as the target in the 1.2835-45 area, at R1. It is possible that My-Wave will not roll over with this move, but get punctured and stay in tact, leaving potential for a deep retracement at the least. The My-Wave rolling range is very tight now, after this sideways action, so expect something punchy! As always, got to stay focused to the possibilities.
Might be a fun day this if price could get above the daily pivot!
Monday, 5 November 2012
EURUSD: 6.00pm GMT
I have a new puppy in the house and I have to say, I reckon there is more fun to be had in watching her grow today than following this price action! Still waiting for the purple 16 'line in the sky' to provide some indication of where to next. Looks like a wave 4 triangle or 5th wave expanding diagonal to finish this wave down off but await confirmation.
I'll post again when we get there, although looking for something impulsive uphill, not corrective.
EURUSD 9.40am
Still waiting for a turnover of the My-Wave but we have a little traction this morning, but only a small bounce thus far, combined with positive divergence on the MACD and an SMI cross over. Update of the 'lines in the sky' targets in this chart provide a moving grid that I am working with (work in progress, as always!) I am looking for a move to purple 16 or green 32 initially, so that I can see what the wave action/psychology is like on arrival and to provide an entry long or short from there. Of course, price may just keep falling forever, but I'll wait. Time to look at the longer term tides and see how the 2monthly has now been tagged above the 38.2% retracement zone for now. The MACD's look downcast but a spring up in price will pull the shorter term study through the longer one. Note the Bollinger bands being pushed hard here - is this a trend now downhill or not.....lets see what happens at the 'line in the sky' purple 16!
EURUSD: 8.15am
The possibility of a move down towards the 38.2% retracement of the 1.2041-1.3171 wave was commented on last night and this morning does seem to be giving that impression. However, we are also at the 50% retracement zone for the rolling yearly high/low range, having bent over backwards to reach here, although the median of the rolling year regression channel is somewhat lower. I have still got a topping area higher in the 1.3200-1.3300 if the annual (gold) cycles trough ahead is to be believed. So, on the basis that what we have been witnessing of late is a corrective 'abc' from 1.3171 in a 4th wave up from 1.2041, we should now see a 5th wave up into the New Year. We could of course be in an impulsive wave downhill and a completely different overall count, but for now, that is what I am working with and I am looking for My-Wave to roll over to the upside, which can be seen is not here yet!
Sunday, 4 November 2012
EURUSD: Weekend summary of near term picture
As of Friday's close, the daily My-Wave was still clearly impulsing downhill, although it had not ventured very far after the US markets opened in the afternoon. There is no trade for me on Sunday night/Monday morning until I see a reaction to Friday's move.
As this last move was clearly impulsive, the next move uphill will help to clarify whether this bearish trend will continue or turn bullish. A sidewards, corrective wave will need to move back to the purple l6 line in this chart, to get me short, with a subsequent trend line break (purple T)to the downside and the MACD dropping through the zero-line. Given we have been pushing the 8hr Bollinger bands on this 60min chart, we may see price drive up through the purple trend line (T) and then up to the green 32 line instead in a sharper move. A break of this line would bring the blue 64 line into play and a stab at the 85.4% fib fan line from the 1.3138 pivot high. However, I would need to see My-Wave turnover completely from where she is right now and that requires some patience to go long! So I'll leave that for now and see what happens first.
The 240min chart houses the weekly, monthly and 2monthly 'tides', and of late we have seen the weekly tide lead prices downhill, whilst the 2monthly catches up. The monthly has been moving sidewards for a while now but at worst is flat, not downhill. With the 2monthly slamming uphill and the daily Bollinger bands being buffeted right now, there is at least good reason to be cautious of a reversal uphill. The whole move from 1.3171 is clearly sidewards to this place in time, bouncing between the daily Bollinger bands and doing little to excite the MACD out of its ranging formation. Leaving possible bigger picture Elliot Wave counts aside, any impulsive move to the upside would suggest to me that we are not in a persistent move downhill right now and that higher is the place to go short again. With the 38.2% retracement zone of the 1.2041 to 1.3171 range, so close however, we might see a push for that in this current move, but I'll be led by the My-Wave rather than predict that for now.
The weekly My-Wave and regression channel analysis seems to be drawing out a 3rd wave down at present in the green channel, leaving room for a 4th wave up and the downward 5th wave ending diagonal to complete the back-test of the blue regression channel and then escape the green channel. This would fit with the need to get back to the purple 16 line in the earlier chart. All conjecture for now, but interesting as ever.
I'll post the longer term charts during the week, once the near term picture becomes a bit clearer.
W.D. Gann's Recommended Reading List
I came across this list and even more useful, downloadable links for all of W.D. Gann's recommended reading, at the Time-Price-Research blog.
Some bedtime reading there for a while! I am going to add this to the useful references links on the right hand side of the screen.
Friday, 2 November 2012
EURUSD 4.20pm
Ending Diagonal looks to have been broken but Friday afternoon in the UK does not look like much energy left thus far. Obviously the My-Wave structure today and 'below the daily pivot' position, hardly inspires longs at this stage but nevertheless, the storyboard is edging around here.
If we do get the pull back here, the first port of call should be the green 32 above or the purple 16 lines. How the price action moves up to these and what happens at the juncture should help to figure out where to go from there. As always, I am led by the intra-day My-Wave from the first chart that says very clearly that what we just saw was impulsive. If we get something impulsive back up rather than corrective, we may just be in for an enjoyable ride.
2.30pm update
Got a small ending diagonal on the daily My-Wave chart. Break out that takes out the 1.2895 area and then holds the low, should be worth an attempt uphill. That would also break over the green 32 line in the sky in the 2nd chart. I have drawn in a 2nd 'green' regression channel in the 3rd chart that should set up the breakout in due course (or not as the case may be!). Just gotta keep following it till we get confirmation.
Photograph: Rabbits on British Camp
Coming off the top of British camp, walking away from Malvern, you will find the hillsides full of rabbit warrens. I was lucky enough to catch a couple on their daily walkabout and will think twice about using these hummocks for skiing next year! Photograph: Rabbits on British Camp

EURUSD: Weekly My-wave
Looks like price is reaching over backwards here to get that kiss in on the regression channel it left back on the 30th October. Time to buy, once we see a higher high and low combination. CHART OF THE WEEKLY MY-WAVE. Price had begun the recent lurch downhill with a bounce off the PINK 'LINE IN THE SKY' (no 256)and showed little respect for the lower order no's on the way down. I had not taken a short there and what a shame too but hope to catch a ride uphill, if the opportunity arises. The next line in the sky (512) is way down at 1.2200 at present(not shown), so if we do not see some traction here, we may be in for a rapid follow through! Really need to see the MACD/EW oscillator in the sub-chart above the zero-line for confirmation of a reversal. The DAILY MY-WAVE is shown here in its full bearish glory and showing at least some awareness of that regression channel perimeter, but someways to go to get above the daily pivot.
Wednesday, 31 October 2012
Photograph: Getting Cooler
This is the pathway that rises up from behind the Lamb Pub in West Malvern. It winds itself around to the top of North Hill and then direct access routes to the Beacon. It is a decent pull, especially in the morning and when that frosty mist is descending, it is both stunning and demanding. Photograph: Getting Cooler

Thursday, 25 October 2012
Photograph: Ash Trees and bracken at British Camp
Well, Autumn is definitely here in Malvern. The red ash trees sit amongst the bracken on British Camp creating quite a view. The changing scenery here is breathtaking some days - just need a frost to set this off rather than the drizzle which continues.

Daily Journal having technical problems
The daily journal and Daily FX.com is not working properly, well at least not from my computer. I'll let you know when it seems to be up and running again.
Wednesday, 24 October 2012
Photograph: Golden Horizon
I am not sure the kids really believe there is a pot of gold at the end of the Rainbow but there sure is gold on Malvern's horizon

Tuesday, 23 October 2012
Photograph: Clouds
Well, not just any clouds. These be the ones where the Ten Commandments would have boomed out from. Given we have yet another day of low lying wringing wet clouds, these ones should lift the spirit: Clouds

Monday, 22 October 2012
Photograph: Malvern Hills from British Camp
Today is not a day to visit Malvern. The clouds are lying low and their drizzley contents waft around the town and hills. Peaceful walking up on the hills this morning though. Here is a photograph of what views are available across the tops when the weather is a little less miserable: Malvern Hills from British Camp

Sunday, 21 October 2012
Lines in the Sky
My weekend report for the EURUSD has been posted in the quick navigation links or can be found here: Lines in the Sky 21st October 2012
Ferrel Cattle on Castlemorton Common
Stunning views of the Malvern Hills can be seen from Castlemorton Common, but the wildlife here comes a bit bigger than your average rabbit. You really do have to watch out for Ferrel Cattle on Castlemorton Common

Friday, 19 October 2012
Photograph: Bluebells in a Field
Them pesky dogs are in the photograph again, but what a fabulous bluebell field. Every year, all over Malvern, fields like this just erupt with the stunning colour. Photograph: Bluebells in a Field

Thursday, 18 October 2012
Greek Tragedy
Seems to me that matters can not continue down this road, however long the road would have seen to have been when the journey began. I have run marathons and triathlons, where the passers by and wonderful spectators keep you going with support and kind words.....is this not quite the opposite? Who in their right minds can be motivated to keep running this particular race? Tens of thousands gather in Athens to protest wage, pension cuts
Photograph: Unusual rabbits on North Hill
I blame it on the water; not Malvern Water mind you - we get ours from Wales - go figure?! Photograph: Unusual rabbits on North Hill.

Wednesday, 17 October 2012
Photograph: Bit Chilly This Morning
Well, not quite this morning but you get the idea. It does get very cold on the hills, with or without snow. Photograph: Bit Chilly This Morning

Tuesday, 16 October 2012
New quick link
Thanks to Alex who wrote in, I have now managed to source Tinypics to create an online collection of the photographs I post on the blog. I have now created a quick navigation link on the left-hand side of the screen for easy access. Hopefully, this will build up into a worthwhile collection, although at the moment, the 'titles' for each photograph are not showing in the slideshow. Something for me to work on!
Elliot Wave counts for EURUSD
I have just posted the latest Elliot Wave counts that I am working with in the Daily Journal (see link, left). In case you have not got around to registering there yet and would like to see what sort charts I work with, here they are to save you the effort:
Chart 1 - Intermediate Picture
Chart 2 - Big Picture
You may need to play with 'zoom' to read them clearly. I post too many articles in the Daily Journal to keep repeating them here, coherently, so do use the link to follow this work.
Photograph: One very pretty Butterfly
Took a few attempts to get this baby in focus - just would not stay still for my studio on the hills. I was quite fascinated with this Butterfly.
Monday, 15 October 2012
Interested in a Skype discussion group?
One of my fellow contributors on the Daily FX Journal came up with the suggestion of creating a Skype discussion group for currency trading. Given I predominantly trade the EURUSD, this might be the focus but can see how from a technical perpective, we could agree on a shortlist of asset classes to discuss.
I have not worked with skype in such a manner before, so fully anticipate teething problems and technical issues. However, if anyone is interested in joining a small group of like-minded individuals during the European, UK & New York trading sessions, send me an email with your contact details and when we get to five potential members, I'll have a look at setting this up.
Photograph: Night Sky over West Malvern
A quite stunning view from my front garden: Night Sky over West Malvern
Sunday, 14 October 2012
Photograph: Moon setting over West Malvern
Just found out that I can not upload my photographs enmasse here through the documents file. So, I'll just have to post them individually for now. Enjoy the Setting Moon over West Malvern
Only just got the broadband connection sorted after months of problems. I just could not get this blog going without the internet firing on all cyclinders. Anyhow, I am there now. I have just built and uploaded the latest Weight Managment diary for 14th October 2012. I am down to 13st 6lb from 14st 4lb since the beginning of September, so perhaps worth having a look at that. In intend to add my favourite recipes for those eveing meals, all calorie counted out, in due course, as a separate section. So, watch this space.
Subscribe to:
Posts (Atom)